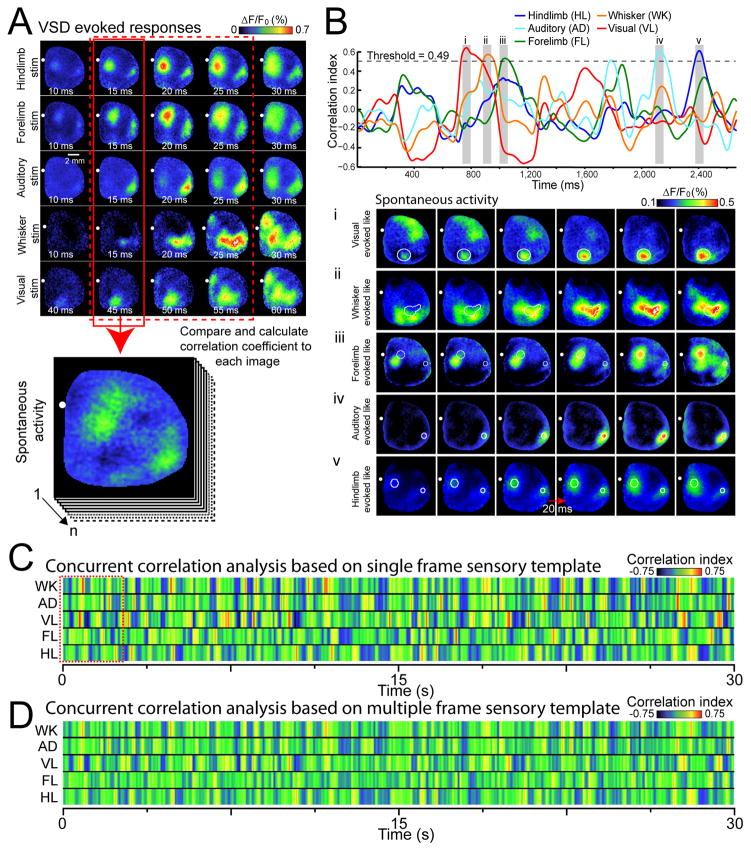
Figure 6. Spontaneous cortical activity can be decomposed into unique repeating sensory motifs.
(A) Representative montages show examples of VSD response to five different forms of sensory stimulation. Each image of spontaneous activity was compared with the sensory evoked templates (pattern at initial cortical response, highlighted by solid red box). VSD responses represent the average of 20–45 trials of stimulation. (B) Top, plot of concurrent correlation of instantaneous patterns of spontaneous activity (2.6 s of spontaneous VSD data as denoted by red dashed square in C with multiple templates of sensory evoked responses. Spontaneous activity was considered to be a “match” to the evoked template if the correlation value was greater than a given threshold (see Supplementary Fig. 8A). Bottom, representative montages (20 ms intervals) showing cortical spontaneous activity that resembles sensory stimulation derived templates, corresponding to shaded gray regions highlighted in the top panel. (C) Pseudocolor image representing a 30 s time course of concurrent correlation of different templates of sensory evoked responses (rows representing whisker (WK), auditory (AD), visual (VL), forelimb (FL), and hindlimb (HL)) with a 30 s epoch of spontaneous activity. The color of each column of pixels represents the correlation value at different times. (D) Concurrent correlation as in C, but using templates of sensory-evoked responses containing the first three frames of sensory-evoked activity following the initial response (highlighted by dashed red box in A).

