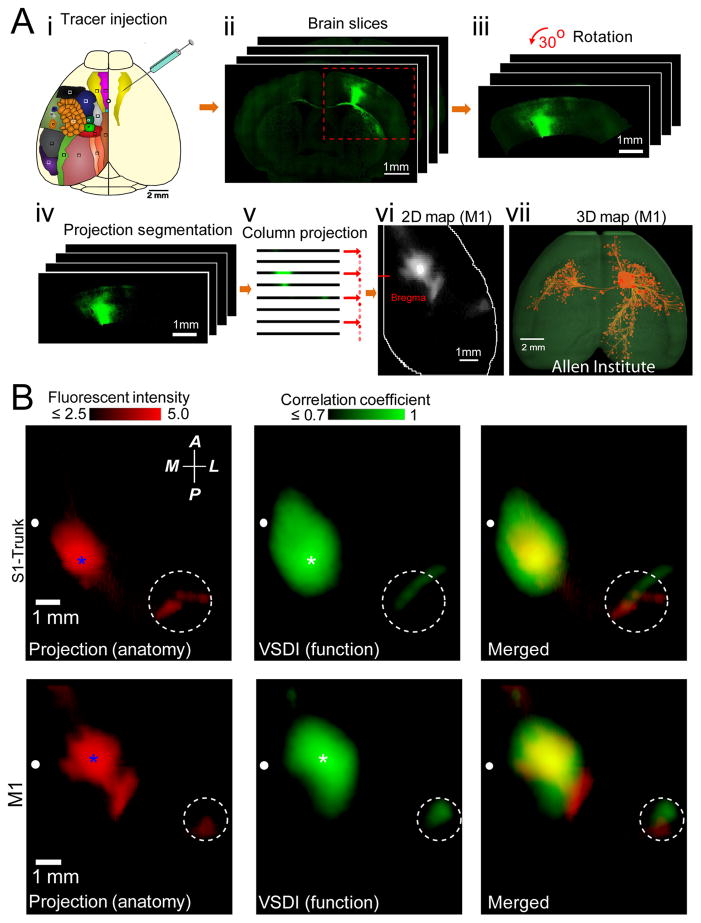
Figure 7. Comparison of cortical axonal projection patterns to correlation maps of spontaneous cortical activity.
(A)(i). Schematic showing injection of AAV tracer to map axonal projections of different cortical regions within the adult mouse brain (data obtained from the Allen Institute for Brain Science). Color-coded cortical locations are as described in Fig. 1. To quantitatively compare the axonal projection maps with functional correlation maps, 2D representations of Allen Mouse Brain Connectivity datasets were created (ii–vi, See Methods). (vii) 3D reconstruction, using Brain Explorer software from Allen Institute for Brain Science, of primary motor cortex axonal projections. (B) Left, example of primary somatosensory trunk (S1-Trunk) and primary motor (M1) cortex axonal projection maps are shown. Pixel intensities scaled logarithmically. Seed-pixel correlation maps obtained from VSD imaging of spontaneous activity within S1-Trunk or M1 cortex are shown in center. Spatial co-localization of axonal projection (left) and correlation (center) maps are shown in right. White dashed circles indicate position of secondary somatosensory cortex. Blue and white stars indicate positions of tracer injection and the seed-pixel, respectively. Position of bregma marked as white circle. Compass arrows indicate anterior (A), posterior (P), medial (M) and lateral (L) directions. See Fig. 8 for group data analysis.

