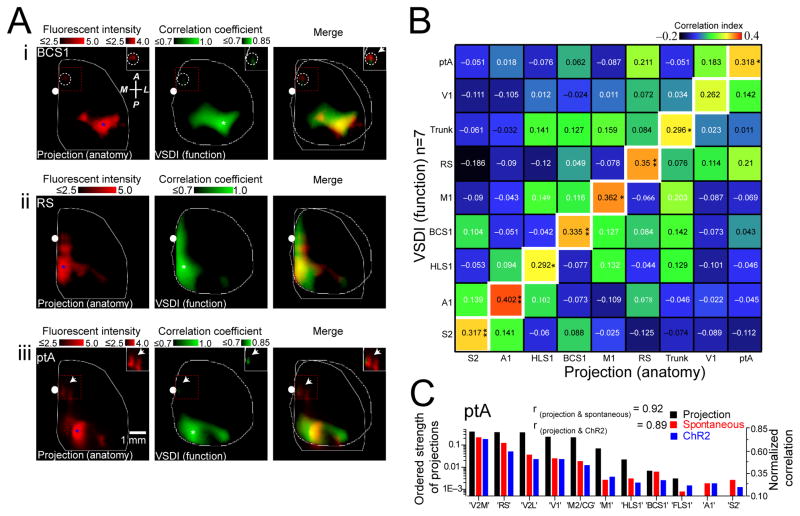
Figure 8. Axonal projection maps are most similar to their corresponding functional maps.
(A)(i) Axonal projection maps (left) of primary barrel somatosensory cortex (BCS1). Blue asterisk denotes AAV injection site. Pixel intensities scaled logarithmically. Note relatively weak pixel intensity in the area outside the injection site (dashed circle). Seed-pixel correlation map (center; presumed similar location to AAV injection site) of BCS1 obtained from spontaneous activity. White asterisk denotes location of seed-pixel. Right, overlay of anatomical and correlation maps. Inset images represent the areas denoted by dashed red boxes and were all re-scaled to the upper right calibration bars. Similar to (i), axonal projection and correlation maps shown for (ii) retrosplenial cortex (RS) and (iii) parietal association cortex (ptA). (B) Matrix showing similarity between VSD correlation (n=7 mice) and axonal projection maps for nine cortical regions. (C) Ordered strength of ptA axonal projections (black) to eleven regions of interest (ROIs) compared to normalized correlation maps obtained from spontaneous activity (red; n=10 mice) or ChR2-evoked VSD responses (blue; n=6 mice). ROIs are ordered based on strength of ptA axonal projection density to other ROIs. The rank order of axonal projection strength was similar to the rank order of functional connectivity strength measured from both spontaneous activity and ChR2-evoked responses (rprojection(ptA)&spontaneous(ptA) = 0.92, rprojection (ptA)&ChR2(ptA) = 0.89, p<0.001 both comparisons). Tests of significance were made against a null hypothesis of axonal projection strength and HL functional connectivity strength (rprojection(ptA)&spontaneous(HLS1)=−0.37, rprojection(ptA)&ChR2(HLS1) = −0.38, p>0.20 both comparisons).

