
Figure 3.
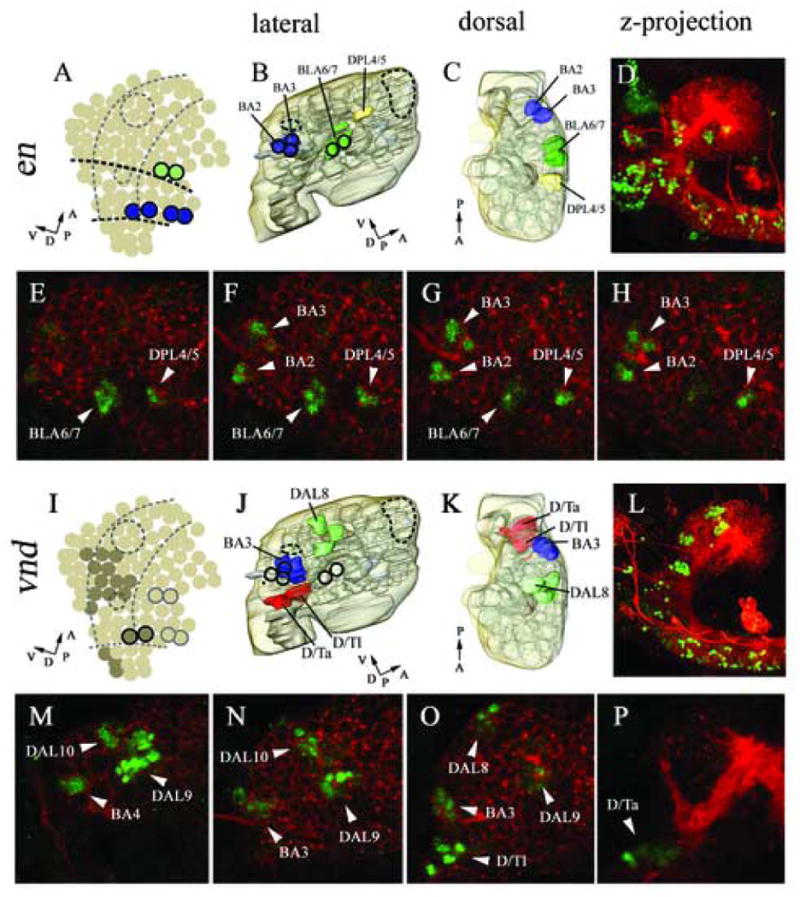
Expression in cortical cell clusters of engrailed (B–H), and ventral nervous system defective (J–P). Marker gene expression in neuroblasts according to Urbach et al., 2003 (A, I). 3D reconstructed models of molecular marker gene expression showing a lateral (B, J), and dorsal (C, K) view. The model includes the neuropile (light grey) and brain surface (transparent light brown). Lateral view of double immunostaining with anti-HRP (red) and anti-EN (green, D–H), anti-VND (green, L–P); confocal microscopic reconstructions of optical sections spanning from the midline to lateral most parts of the brain, lateral view (D, L). High magnification single confocal sections within the brain cortex from distal most (E, M) to medial most (H, P); intermediate sections (F, G, N, O). en expression is found at neuromeric boundary regions in specific cortical clusters (B, C, D). Anti-EN staining is found in the BLA6/7, BA3, BA4 and DPL4/5 clusters (E–H). vnd is expressed in specific clusters in the ventral part of the cortex (according to neuraxis) (J, K). Anti-VND staining is found in the DAL8, DAL9, DAL10, BA2, BA1, D/Ta and D/Tl clusters (M–P). For major landmarks engrailed expression (dark circles) and mushroom bodies (large dashed circle) and FasII cluster (small dashed circle) are displayed (A, B, I, J). (A, I) Dashed lines indicate columnar domains of the embryonic neurectoderm. (A) Dark dashed lines indicated neuromeric boundaries between protocerebral (anterior), deuterocerebral (middle) and tritocerebral (posterior) domains. (A, B, C, I, J, K) Perpendicular arrows show the anteroposterior and dorsoventral orientation of the brain according to neuraxis. For orientation specific clusters are labelled by name, for nomenclature see material and methods.