
Figure 5.
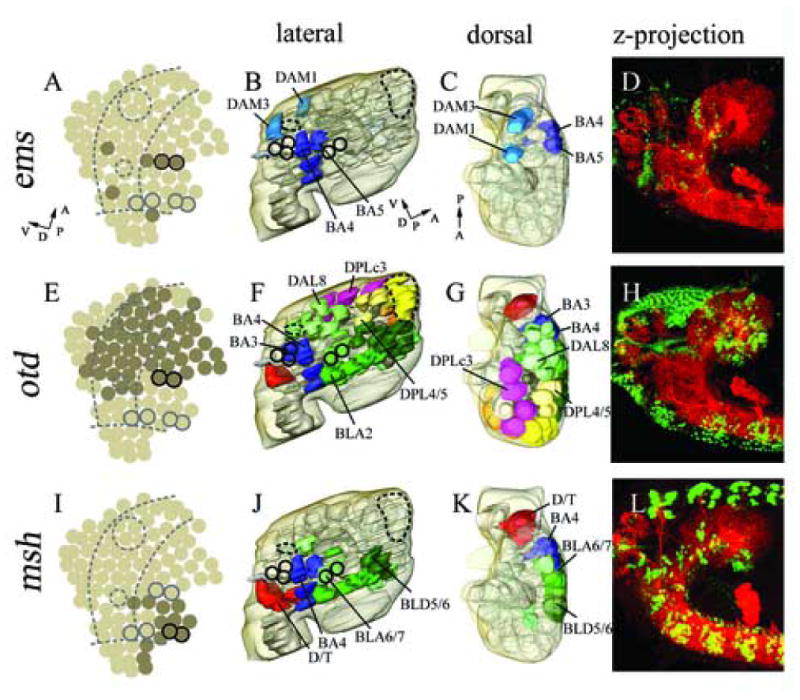
Expression in cortical cell clusters of ems (B–D), otd (F–H) and msh (J–L). Marker gene expression in neuroblasts according to Urbach et al., 2003 (A, E, I). 3D reconstructed models of molecular marker gene expression showing a lateral (B, F, J), and dorsal (C, G, K) view. The model includes the neuropile (light grey) and brain surface (transparent light brown). ems expression is restricted to a small number of cell clusters in an AP intermediate part (B, C), whereas otd expression covers large parts of the brain cortex (F, G). msh expression locates more in dorsal parts of the embryonic brain cortex (according to neuraxis) (J, K). Double immunostaining with anti-HRP (red) and anti-EMS (green, D), anti-OTD (H), anti-MSH (L); confocal microscopic reconstructions of optical sections spanning from the midline to lateral most parts of the brain, lateral view. For major landmarks engrailed expression (dark circles) and mushroom bodies (large dashed circle) and FasII cluster (small dashed circle) are displayed (A, B, E, F, I, J). (A, I) Dashed lines indicate columnar domains of the embryonic neurectoderm. (A, B, C) Perpendicular arrows show the anteroposterior and dorsoventral orientation of the brain according to neuraxis. For orientation specific clusters are labelled by name, for nomenclature see material and methods.