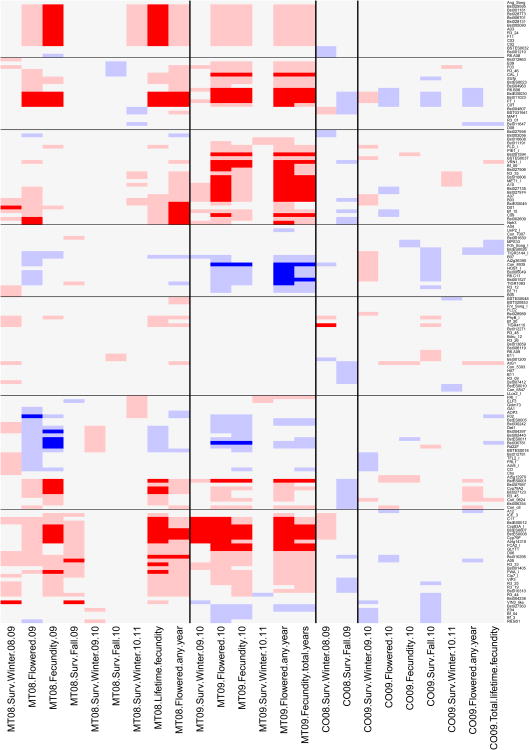
Figure 5. Heatmap of significant QTL for fitness components.
Rows show results for each molecular marker, and columns indicate individual episodes of selection. Sites and cohorts are separated by black vertical lines, and chromosomes are delimited by horizontal black lines. Marker names and fitness components are indicated along the right and bottom margins, respectively. For the fitness components, sites and cohorts are represented by state codes and two number years (e.g., MT08 is Montana 2008 cohort). Surv.Winter is overwinter survivorship, flowered is the probability of flowering, fecundity is the number of fruits, Surv.Fall indicates growing season survivorship. Non-significant selection coefficients are in light gray. Dark red (dark blue) indicates selection favoring the Montana (Colorado) allele, with significance based on the genome-wide threshold. Light red (light blue) indicates selection favoring the Montana (Colorado) allele, with significance based on the per-locus threshold. See text for details.

