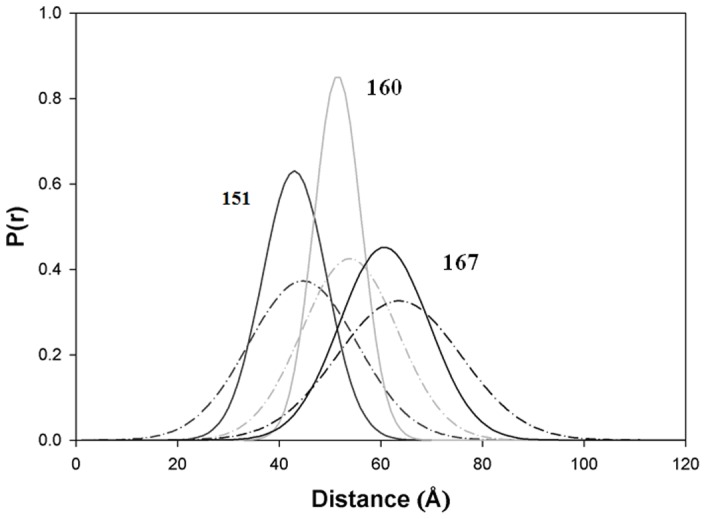
Figure 1. FRET distance distribution between cTnT and cTnI.

Distribution of the distances P(r) between cTnT residue 276 and cTnI residues 151, 160, and 167, determined in the reconstituted cTn complex at low Ca2+ (broken curve) and saturating Ca2+ (solid curve).
