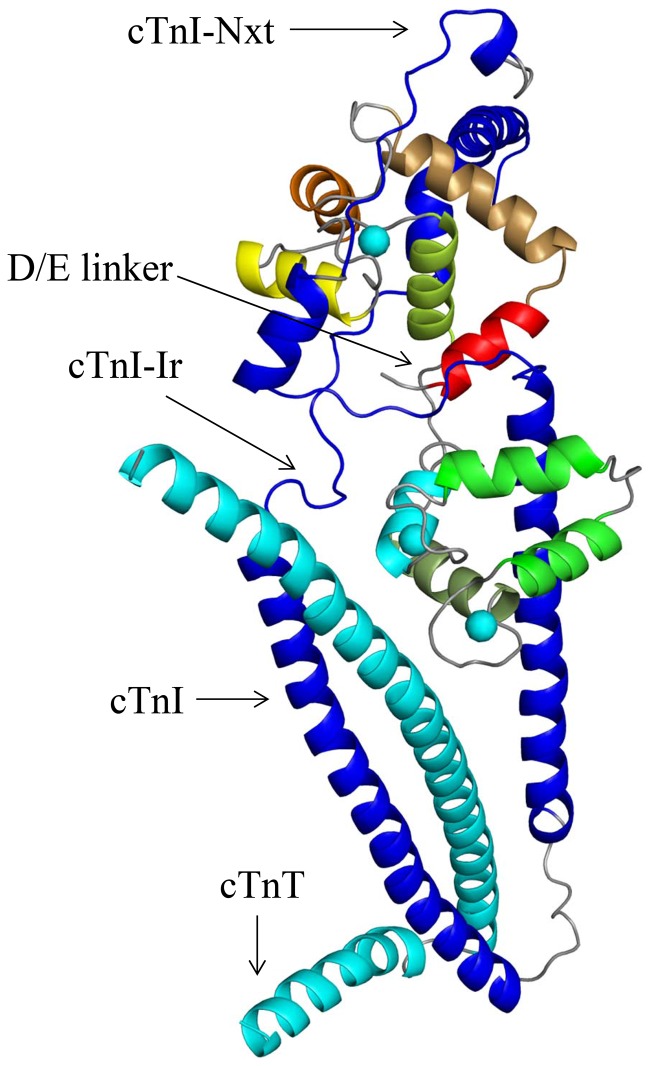
Figure 2. The starting structure for MD simulations.
The crystal structure (1J1E.pdb [10]) of the cTn complex at saturating Ca2+ is depicted with the N-terminal extension of cTnI (cTnI-Nxt) docked over the cTnC N-domain. The N-terminal extension of cTnI was docked to the cTn complex using Hex, a protein-protein docking program. The cTnT and cTnI are colored cyan and blue respectively. The cTnC helices N, A, B, C, D in the N-domain are colored, red, mustard, orange, yellow and lime green. The bound Ca2+ ions at sites 2, 3, and 4 are rendered as spheres and colored cyan.

