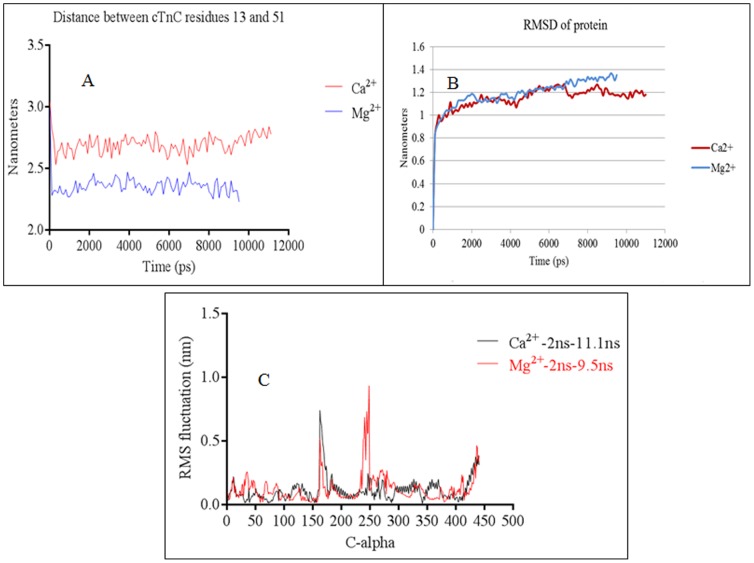
Figure 3. Data from MD simulations.
(a) The opening and closing of the cTnC N-domain was monitored by measuring the distance between the Cα of cTnC residues 13 and 51. The residues 13 and 51 are located on helix A of cTnC and on the linker region of helices B and C, respectively. In the Ca2+-free state the distance between the two residues decreased because the cTnC N-domain hydrophobic pocket closed (due to the loss of Ca2+ from the cTnC site 2). In the Ca2+-saturated state, the distance between these two residues increased as they moved away from each other because the hydrophobic pocket opened (due to Ca2+ in cTnC site 2). The Y-axis represents the distance (in nanometers) between the cTnC residues 13 and 51. (b) Depicts that RMSD of the protein in the Ca2+-saturated and Ca2+-free states. (c) The root mean square fluctuations of the cardiac troponin complex was calculated after allowing the initial 2 ns for equilibration. In the graph the C-alphas from 1–161 pertain to cTnC, 162–249 pertain to cTnT, 250–442 pertain to cTnI. Fluctuations of more than 3 Å are observed between C-alphas 162–177 in both the Mg2+ (Ca2+ free) and Ca2+ saturated states. This pertains to cTnT N-terminal helix H1 (C-alpha 162–177 in the graph pertain to residues 202–217 in the crystal structure). Fluctuations are also observed towards the C-terminal end of cTnT helix H2 in the Mg2+ state (C-alpha 234–249 in the graph pertain to cTnT residues 273–288 in the crystal structure). Towards the end of the X-axis we can see that the C-terminal end of cTnI experiences fluctuations in both the biochemical states. This pertains to the cTnI-Md.

