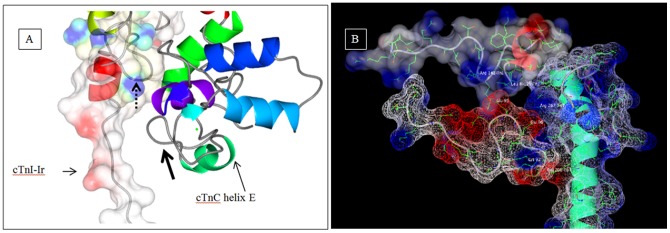
Figure 6. Electrostatic surface analysis of the cTnC and cTnI.

Depicts the electrostatics in the vicinity of cTnC helix E in the Ca2+-free state after 9.5 ns of simulation. The hydrophobic, negative and positive surfaces are colored white, red and blue respectively. (a) The thick arrow points to the unfolded segment in helix E. The positively charged blue residues of cTnI-Ir are seen arching (pointed to by the dotted line with arrow head) towards the unfolded cTnC helix E (pointed to by thick black arrow). The amino acids sequence of the cTnI-Ir residues is 138-KFKRLPT and the sequence of the opposing cTnC residues are 92-KSEEEL. The predominantly negative (red) cTnC helix E is attracted to the positive region of cTnI-Ir. The unfolded helix E has adopted a “U” shape (pointed to by the thick black arrow). (b) The unfolded helix E is seen in concert with cTnI and cTnT. The cTnC Glu94 is attracted to cTnI Lys141 (not seen in picture), cTnC Glu95 is attracted to the nitrogen on Leu129 of cTnI and Arg142 of cTnI, and cTnC Glu96 is attracted to Arg 267 of cTnT.
