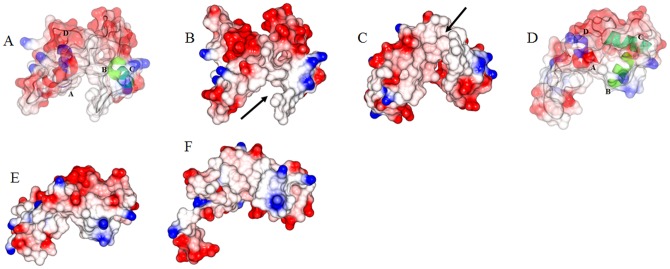
Figure 7. Electrostatic surface analysis of the N-domain of cTnC.
Depicts the N-domain of cTnC in the Ca2+-free state (figures a through c) and Ca2+-saturated states (figures d through f). The cTnC N-domain helices A through D are colored as red, green, cyan and blue respectively. (a) Transparent rendering of the electrostatic surface is shown with the protein in cartoon. (b) In the Ca2+-free state the loss of regulatory Ca2+ caused the rearrangement of helices B and C. These helices are no longer orthogonal to each other but nearly parallel. This resulted in a breach in the hydrophobic pocket that surrounded the cTnI-Rr (pointed out by the arrow). (c) The cTnC N-domain hydrophobic pocket when viewed from below the cTnC N-domain. This view shows the hydrophobic environment in which the cTnI-Rr is located. The arrows points to the gap in the hydrophobic pocket. (d) Transparent rendering of the electrostatic surface with the protein rendered as cartoon. (e) In the Ca2+-saturated state there is no breach in the hydrophobic pocket within which the cTnI-Rr is held. (f) The cTnC N-domain hydrophobic pocket in the Ca2+-saturated state when view from below.

