Figure 7.
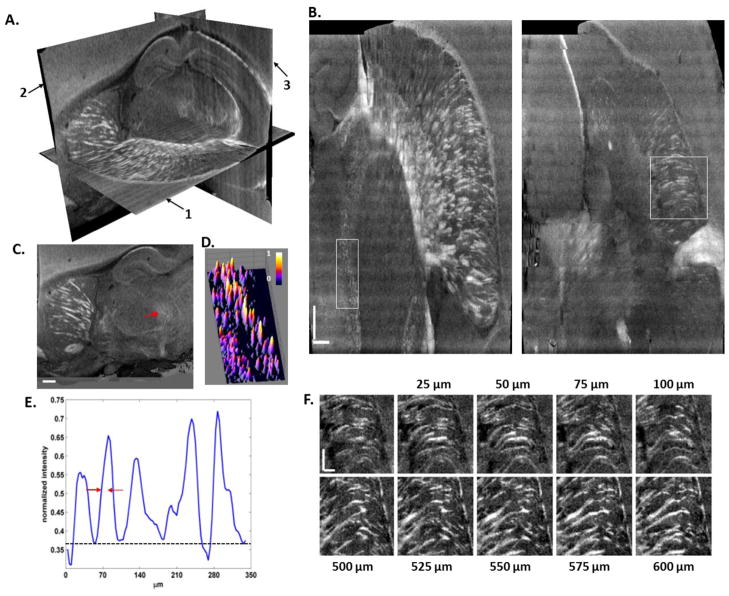
Reconstruction of rat brain at natural resolution of SOCS. (A) 3D reconstruction with orthogonal views, 1: horizontal, 2: sagittal, 3: coronal. (B) The horizontal planes are constructed by stitching the cross sectional images of serial scans. Most of the neuronal tracts appear bright, whereas the fibers oriented perpendicular to the illumination plane may appear rather dim. The rectangular ROI represents small fibers in the midbrain region exampled by an arrow in C. Surface plot (D) and intensity profile along a vertical line (E) clearly illustrate individual fiber tracts. (F) Trajectories of small fibers are shown on sequential sections along y-axis towards superior direction. The first image specifies the square ROI of B. Pixel sizes: 7 × 3.47 μm2 for B and F, and 7 × 7 μm2 (interpolated) for C. Scale bars: 500 μm in B and C, and 250 μm in F.

