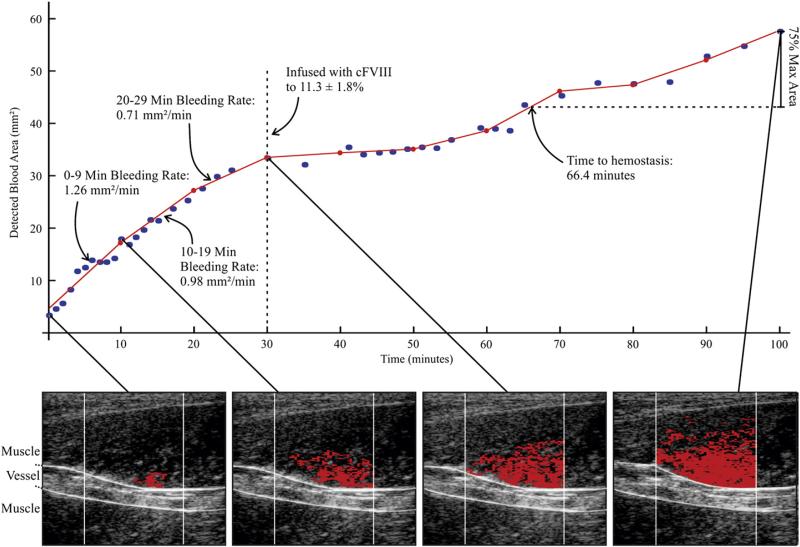
Fig. 2.
Methods of Bleeding Rate and Time to Hemostasis Estimation using ARFI-Monitored Hemostatic Challenge – (bottom row) In serially acquired ARFI frames in a naïve hemophilia A dog, hemorrhage pixels (red) are identified [36] and associated cross-sectional area (CSA) calculated. (top graph) CSA is plotted versus time of image acquisition (blue dots). The CSA plot is subdivided into (in this example, 10 min) intervals, and a line is fit using a linear least-squares regression approximation (red lines). The slopes of the lines are recorded as the bleeding rate [mm2/min]. Time to hemostasis onset is estimated as time to 75% of the maximum observed hemorrhage CSA. FVIII was given at 30 min to 11.3±1.8% of normal.

