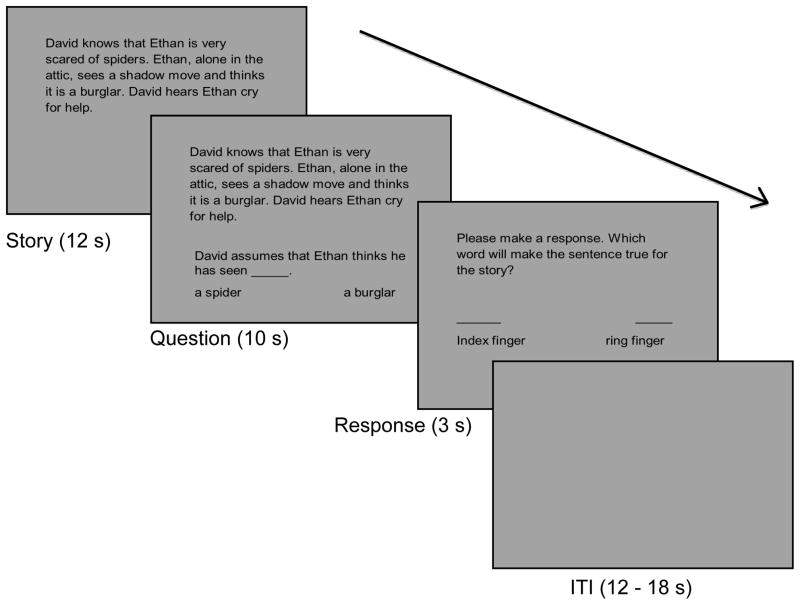
Figure 1.
A schematic diagram of the Belief Attribution Task showing the temporal sequence of a single event. At the beginning of each trial, a vignette was presented for 12 seconds. A fill-in-the-blank question was presented for 10 seconds while the vignette was still visible. After the vignette and question disappeared, a response probe was presented for 3 seconds. The inter-trial interval (ITI) was jittered between 12 and 18 seconds.

