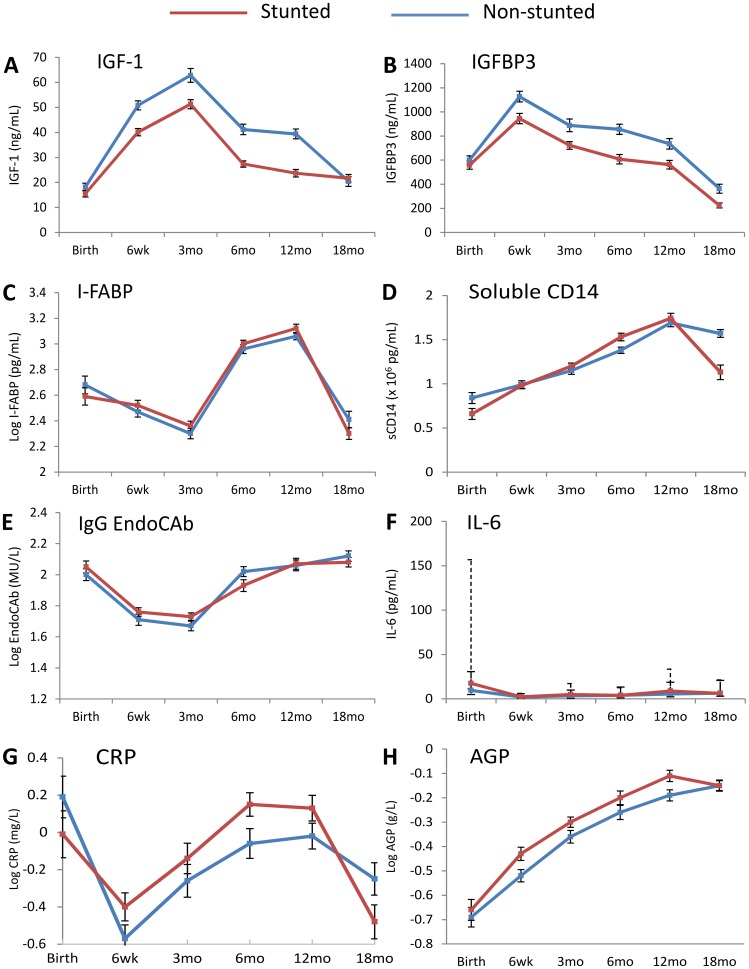
Figure 3. Changes in biomarkers over the first 18 months of life.
Levels of A: Insulin-like growth factor 1 (IGF-1), B: IGF-binding protein 3 (IGFBP3), C: Intestinal fatty acid binding protein (I-FABP), D: Soluble CD14 (sCD14), E: IgG endotoxin core antibodies (EndoCAb), F: Interleukin-6 (IL-6), G: C-reactive protein (CRP) and H: Alpha-1 acid glycoprotein (AGP), in non-stunted (blue line) and stunted (red line) infants between birth and 18 months of age. Data shown are means with standard errors, except for IL-6, which shows medians with interquartile range (solid error bars for non-stunted infants and dashed bars for stunted infants). Mean levels, standard deviations, unadjusted and adjusted differences between cases and controls are shown in Table S1.

