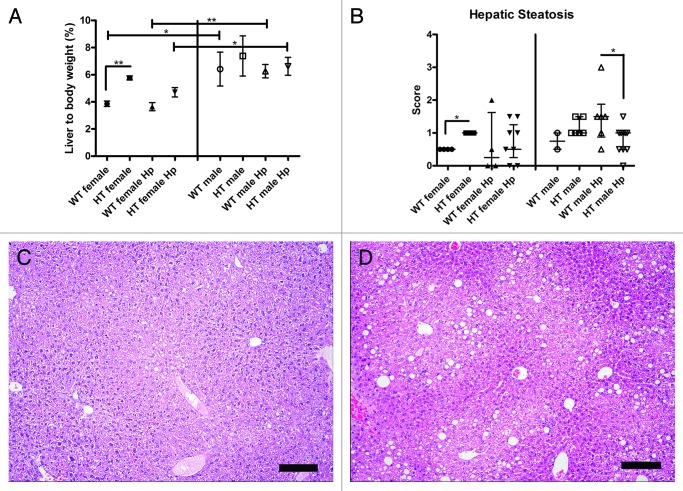
Figure 1. (A) Liver to body weight ratio (%) in the different groups of mice. No liver or body weight was available for three mice in different groups including WT female Hp, HT female, and HT female Hp (*, p < 0.05; **, p < 0.01). (B) Hepatic steatosis scores in the different groups of mice (*, p < 0.05). (C) Normal liver in a hepatitis C virus transgenic male mouse infected with H. pylori (HT male Hp). (D) Mild fatty degeneration in the cytoplasm of centrilobular hepatocytes in a wild-type male mouse infected with H. pylori (WT male Hp). (C and D) bar size 100 µm.

An official website of the United States government
Here's how you know
Official websites use .gov
A
.gov website belongs to an official
government organization in the United States.
Secure .gov websites use HTTPS
A lock (
) or https:// means you've safely
connected to the .gov website. Share sensitive
information only on official, secure websites.
