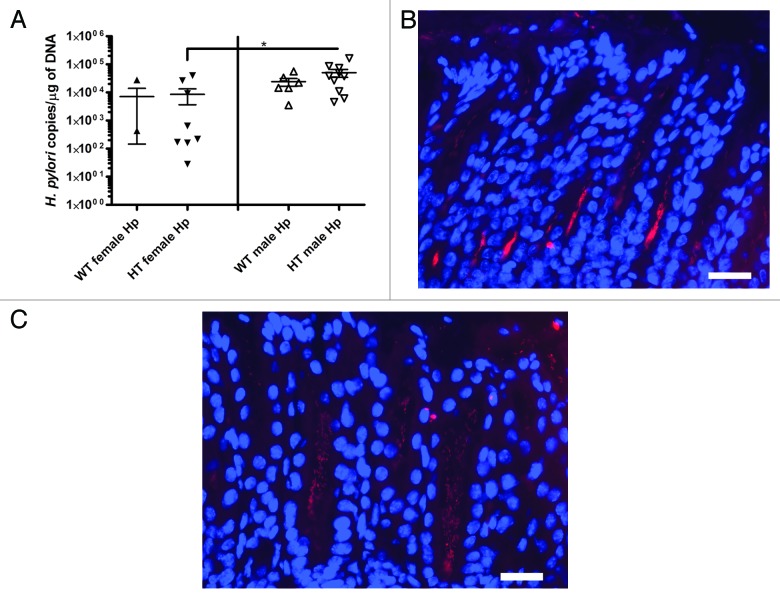
Figure 3. (A) Colonization of H. pylori in the stomach analyzed with quantitative PCR (*, p < 0.05). Values are expressed as H. pylori copies per µg of mouse DNA. Values for three mice without H. pylori colonization are not shown in the graph. (B) Fluorescent in situ hybridization (FISH) of H. pylori in the gastric antrum of an infected hepatitis C virus transgenic male mouse (HT male Hp). (C) FISH of H. pylori in the gastric antrum of an infected hepatitis C virus transgenic female mouse (HT female Hp). (B and C) bar size ~20 µm.

An official website of the United States government
Here's how you know
Official websites use .gov
A
.gov website belongs to an official
government organization in the United States.
Secure .gov websites use HTTPS
A lock (
) or https:// means you've safely
connected to the .gov website. Share sensitive
information only on official, secure websites.
