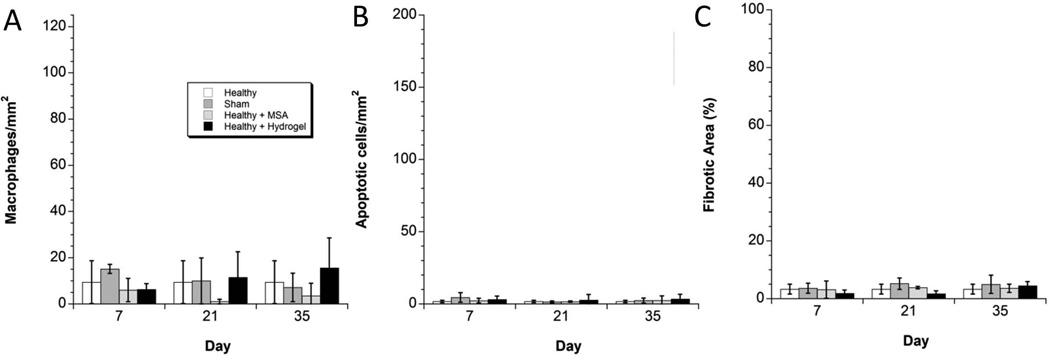
Figure 6.
Quantitative Analysis of the Control Groups. (A) In the control groups, there were no statistically significant differences in macrophages/mm2 at any time-point. Injecting the hydrogel into healthy kidney did not incite macrophage infiltration. (B) In the control groups, there were no statistically significant differences in apoptotic cells/mm2 at any time-point. Injecting the hydrogel into healthy kidney did not incite apoptosis. (C) In the control groups, there were no statistically significant differences in percentage of fibrosis at any time-point. Injecting the hydrogel into healthy kidney did not incite fibrosis.

