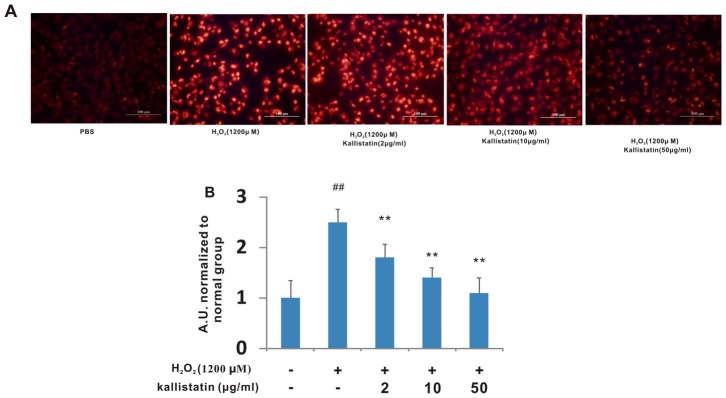
Figure 5. Effect of kallistatin on intracellular ROS levels after H2O2 exposure in LX-2.

Cells were treated without or with kallistatin (2 µg/ml, 10 µg/ml and 50 µg/ml, respectively) prior to H2O2 challenge. ROS levels were measured using fluorescent probe DCFH-DA from the cells. (A) Representative images of ROS levels. Scale bars = 100 µm. (B) Intensity arbitrary units (A.U.) reflecting the relative value of intracellular ROS levels. Each value represents the mean±SD of triplicates. ## p<0.01 vs. normal; **p<0.01 vs. H2O2 alone.
