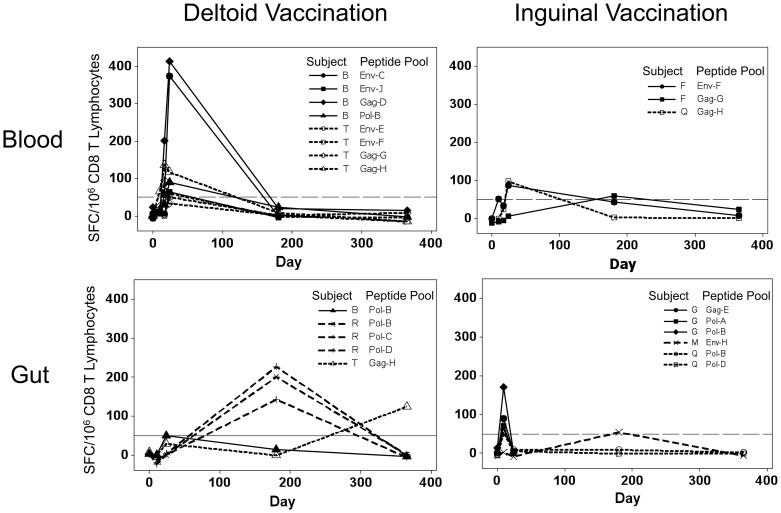
Figure 5. Kinetics of HIV-1-specific CTL responses within individuals.
CTL responses that achieved a magnitude of ≥50 spot-forming cells per million CD8+ T lymphocytes at any time are plotted. The upper and lower panels show blood and gut mucosal responses respectively, and the left and right panels give results for persons who received deltoid and inguinal vaccinations respectively.

