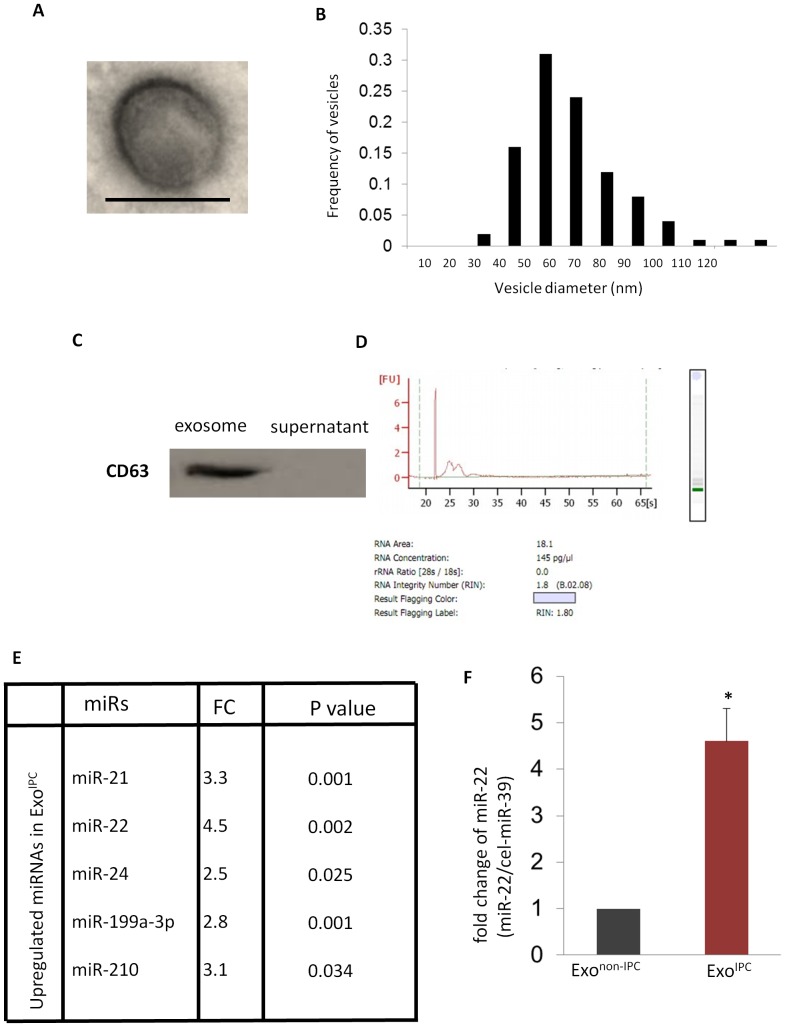
Figure 1. miR-22 is upregulated in ExoIPC.
A. Electron microscopy was used to image the structure of an exosome, which was approximately 100 = 100 nm. B. Histogram showing exosome size distribution. X values: Vesicle diameter (nm); Y value: frequency of vesicles. C. Equal amounts of proteins from exosomes and culture medium were analyzed by western blotting for the exosome-enriched protein, CD63. D. RNA analysis by bioanalyzer showed no ribosomal RNA 28 s and 18 s presence. E. microRNA microarray data showing upregulation of miRs in ExoIPC as compared to Exonon-IPC. ExoIPC exosomes from MSCs following ischemic preconditioning. Exonon-IPC: exosomes from MSCs without ischemic preconditioning. FC: fold change (ExoIPC vs. Exonon-IPC). F. qPCR was performed to confirm the enrichment of miR-22 in exosomeIPC as compared to exosomenon-IPC. cel-miR-39 was used as invariant control. (*) denotes P<0.05 for significant difference (n = 3). ExoIPC exosomes from MSCs following ischemic preconditioning.

