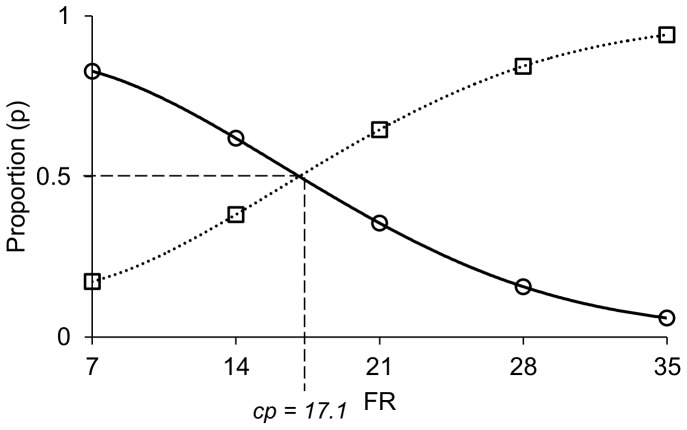
Figure 2. Cross point analysis illustrated.
Graphical representation of the cross point (cp) of calf no. 2 for the comparison chopped hay (circles) versus long hay (squares) using proportions (p) of chopped hay rewards over total number of rewards. The proportions for long hay rewards were calculated as 1 - p. The x axis shows fixed ratio (FR) values for the chopped hay (the long hay fixed ratio values are 42 - FR). The lines connecting the points are 4th order polynomials.

