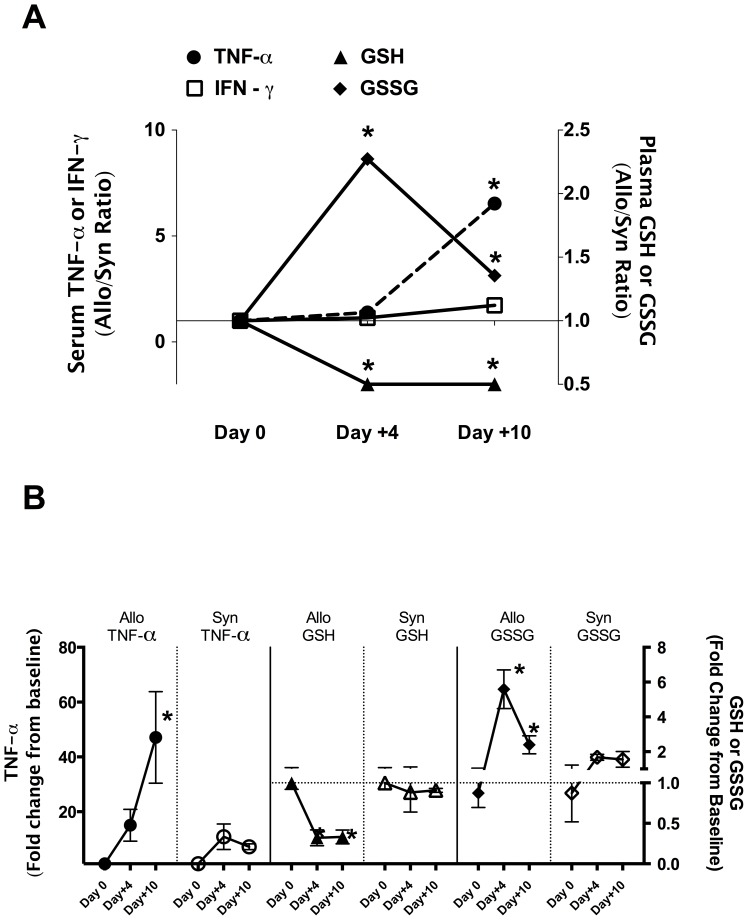
Figure 3. Temporal change in GSH oxidation and loss precedes the rise in TNF-α.
Lethally irradiated B6 recipients (Irradiated) were transplanted with 5×10⁶ T-cell depleted bone marrow cells (TCD-BM) and 3×10⁶ CD90+ T-cells from B6 Thy1.1 (Syngeneic) or Balb/C (Allogeneic) donor mice (N = 4 per group). Serum TNF-α, plasma GSH and GSSG concentrations were normalized to average control values. Panel A shows the temporal patterns of mean Allo/Syn ratios of control-normalized serum TNF-α (left axis; circle dotted line), plasma GSH (open triangle, right y axis) and GSSG (open diamond right axis). Panel B shows the temporal changes in serum TNF-α, plasma GSH and GSSG for Allo and Syn groups separately and values are expressed as fold-change over baseline control mean. *Denotes significant differences between Allo and Syn BMT mice. Data represents mean ± SD.

