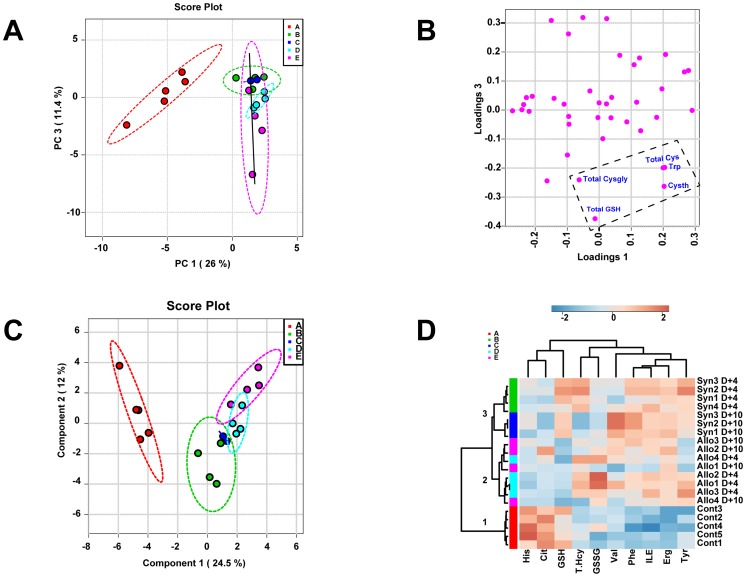
Figure 5. Plasma metabolome discriminates Allo from Syn BMT and untreated controls at Day+4.
Lethally irradiated B6 recipients were transplanted with 5×10⁶ T-cell depleted bone marrow cells and 3×10⁶ CD90+ T-cells from B6 Thy1.1 (Syngeneic) or Balb/C (Allogeneic) donor mice (N = 4 per group). Principal component analysis (PCA) and partial-least squares discriminant analysis (PLS-DA) was performed using plasma metabolite concentrations quantified at Day+4. Panel A shows the PCA scores plot. The different colors and letters signify the five groups in the study: Healthy controls (A; red), Syn Day+4 (B; Green), Syn Day+10 (C; Blue), Allo Day+4 (D; Cyan), and Allo Day+10 (E; Purple). Untreated controls and the BMT groups are separated along the PC1 axis whereas Allo are separated from the Syn group along the PC 3 y-axis. Solid line shows the direction of Allo separation from Syn. Panel B shows the corresponding PCA loading plot for PC1 and PC3 shown in panel A. Total Cysgly, GSH, Cys, Trp and Cysth were variables that contributed the most to the separation of groups identified by the PCA analysis. Panel C shows the PLS-DA scores plot. The group IDs are represented by letters and colors described in Panel A. Panel D shows the heat-map generated from the top 10 metabolites contributing to group discrimination as identified by PLS-DA analysis. Each metabolite is arranged in columns and the individual concentrations within a column are normalized by respective median concentrations. Rows represent different mice and their group ID is shown on the right side of each row. These group IDs are represented by different colors on the left side that correspond to the same color codes in Panels A and C. Concentrations that are two fold above or below the mean are highlighted in amber or in blue, respectively. Dendogram and the 3 nodes (1–3) classified by hierarchical clustering analysis are shown on the left.

