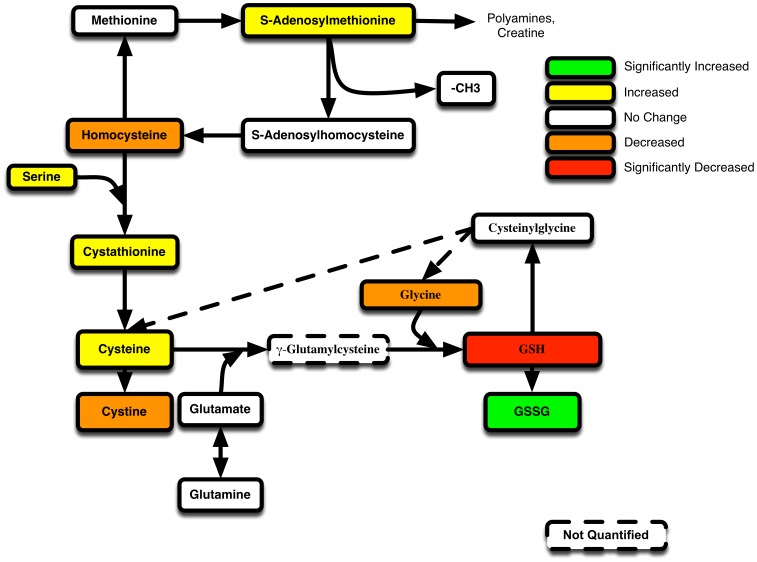
Figure 6. GVHD associated shifts in GSH metabolism in Allo relative to Syn BMT at Day+4.
The pathway map of GSH-synthesis related metabolites are shown. The significance (p value) and the trends for the mean concentration differences between Allo and Syn mice are denoted by different colors. Green represents metabolites with mean concentrations in Allo mice that are significantly (p>0.5) increased (>25%) over syn mice. Yellow represents metabolites that are increased (>25%) in Allo, but was not statistically significant (p>0.05). White denotes metabolites that did not change greater ±25%. Orange represents metabolites whose mean concentration in Allo decreased by more than 25%, but did not reach significance (p>0.05). Red identifies metabolites that decreased in Allo by more than 25% and was also significant (p<0.05).

