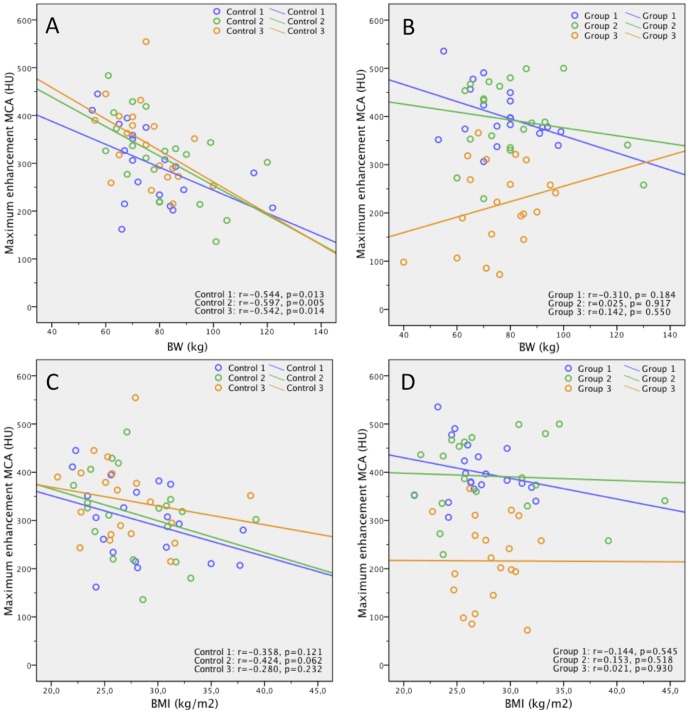
Figure 1. Correlation of body weight/BMI and ME in the MCA.
Scatterplots show relationship between patient body weight (BW) (kg) as well as BMI (kg/m2) and ME of MCA (HU) for the three controls (A, C) and for the three groups (B, D). Lines are regression lines. Spearman's rank correlation coefficients (r) and p-values are provided in the lower right corner.

