
Figure 3.
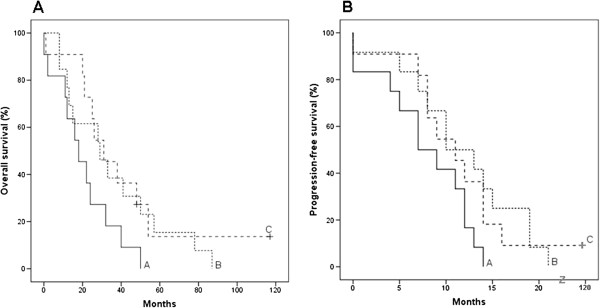
Kaplan-Meier survival curves for miR-200c-3p expression in HGSC patients. Overall survival (OS) curves (A) and progression-free survival (PFS) curves (B) according to miR-200c-3p expression level (FC) tertiles in patients with high-grade serous ovarian carcinomas (HGSC, n = 35) based on significant association between miR-200c-3p and PFS (p = 0.031) and OS (p = 0.026). A: High expression. B: Intermediate expression. C: Low expression. The symbol “+” indicates censoring. Median time until progression and death is given in Table 1.