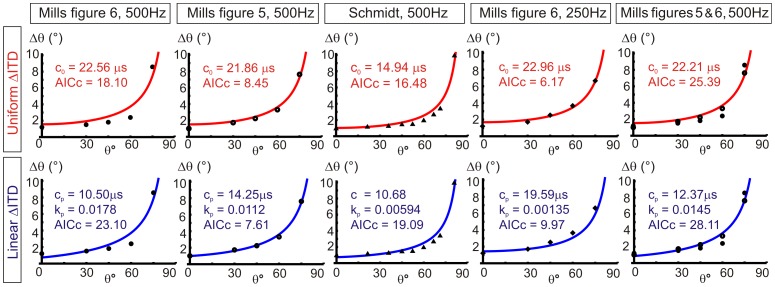
Figure 4. Best-fit acuity curves for uniform or linear ΔITD distributions.
Candidate uniform and linear ΔITD models used to find best-fit acuity (Δθ) distributions for five acuity data sets. Uniform distributions are described by parameter c0 and linear distributions are described by parameters cp and kp. As with the best-fit descriptions of ΔITD distributions, best-fit acuity distributions have low kp values for the linear ΔITD case, close to the uniform case. AICc values indicate that the majority of acuity data sets are more appropriately described by uniform ΔITD distribution as these have lower AICc values than for a linear ΔITD distribution (comparing the same data sets).

