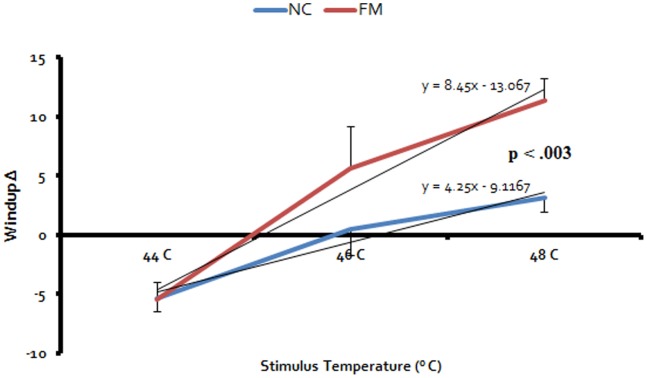
Figure 2. WU-RFs of average (SEM) WU-Δ scores of NC and FM subjects during trains of 44°C, 46°C, and 48°C heat pulses to the hands.
WU-Δ scores monotonically increased with increasing stimulus intensities (p<.001) for NC (blue line) and FM subjects (red line). However, the slopes of WU-RF were significantly steeper for FM subjects compared to NC (p<.003).

