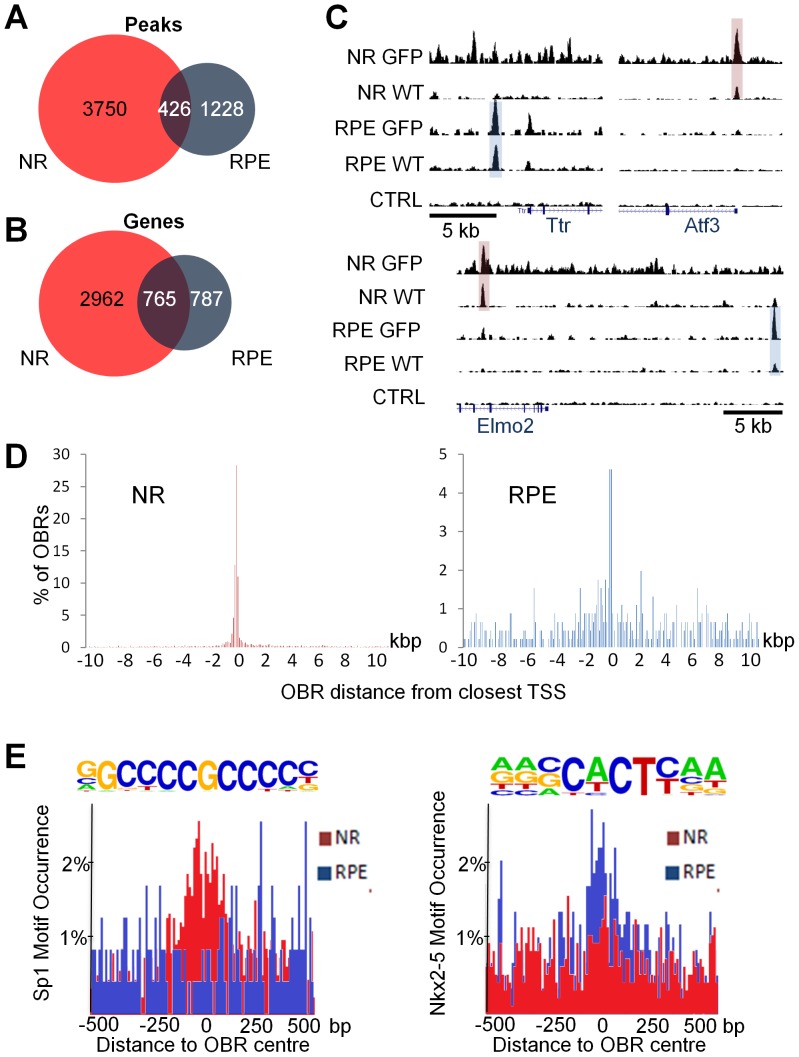
Figure 4. Contrasted Otx2 genome occupancy in neuroretina and RPE.
A. Venn diagram showing the overlap of OBR core sets in NR (red) and RPE (blue). B. Venn diagram showing the overlap of the closest genes to core set OBRs. C. Representative examples of OBR localization in RPE-specific (Ttr), NR-specific (Atf3) and common (Elmo2) genes. Shown are browser captures for the 4 ChIP-seq assays and control. The gene is indicated in blue at the bottom. D. Distribution of distance from the closest transcription start site (TSS) in NR and RPE for all OBRs lying within 10 kb from a known TSS. E. Distribution of Sp1 and Nkx2-5 motif occurrence 1 kb around the centre of OBRs in the NR (red) and the RPE (blue).

