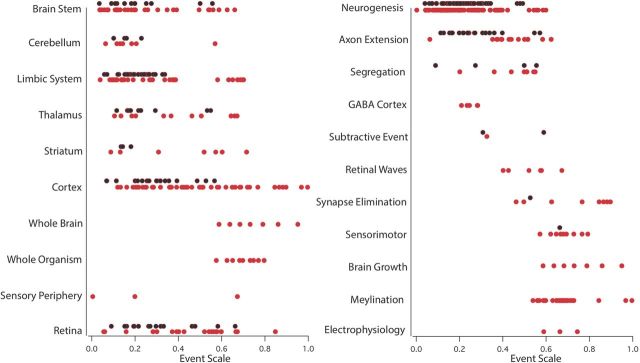
Figure 1.
The distribution of the neural location (left) and general class of developmental process (right) of events used to develop the model, plotted against the event scale. The event scale, which is described in more detail in Figure 3, is a ranking of all these events on a scale from 0 to 1, and principally represents their order of occurrence across all of the species. New events added in this data analysis compared with the original model (Clancy et al., 2001) are in red and show not only the addition of late behavioral, physiological, and overall growth information to the model but also addition to the database throughout; events common to both in black.

