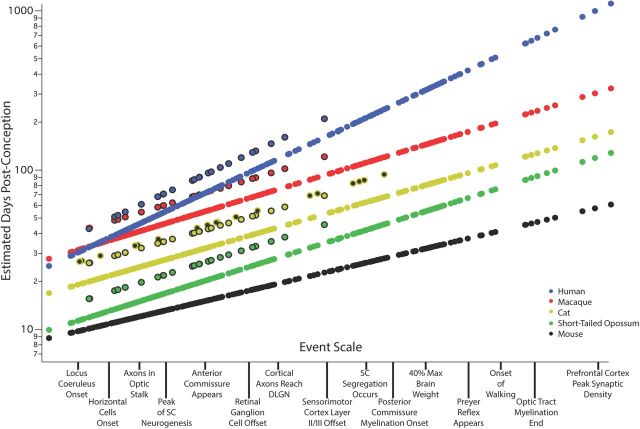
Figure 2.
Predicted developmental schedules for human (blue circle), macaque (red circle), cat (yellow circle), short-tailed opossum (green circle), and mouse (black circle), selected from the 18 species to illustrate the full range of developmental durations. In this graph the event scale is the x-axis, to which we have added a subset of the 271 events that were observed. This scale ranges from 0 to 1, but in this case, event scale numerical values are replaced by these example events. As will be described in Figure 3, the event scale is a common ordering of developmental events across all species. The y-axis is the estimated date of occurrence of each event in each species from conception (log scale). To determine when a particular event would be predicted to occur in any species from this graph, using the name of the event on the event scale, find where it intersects the regression line for that particular species. The y-axis value will be the predicted PC day for that event/species combination. In future graphical representations of the event scale, the event scale value for any named event can be found in Table 1. Also represented on this graph are interaction terms for corticogenesis and retinogenesis, with interaction terms always associated with individual species. The parallel lines for a subset of events in four of the species (black bordered circles for human, macaque, cat, and possum) represent delays in cortical neurogenesis with respect to their time of occurrence in the rodent and rabbit. In the cat, a second parallel line can be seen representing the delay of retinal neurogenesis (yellow circle with a black dot).

