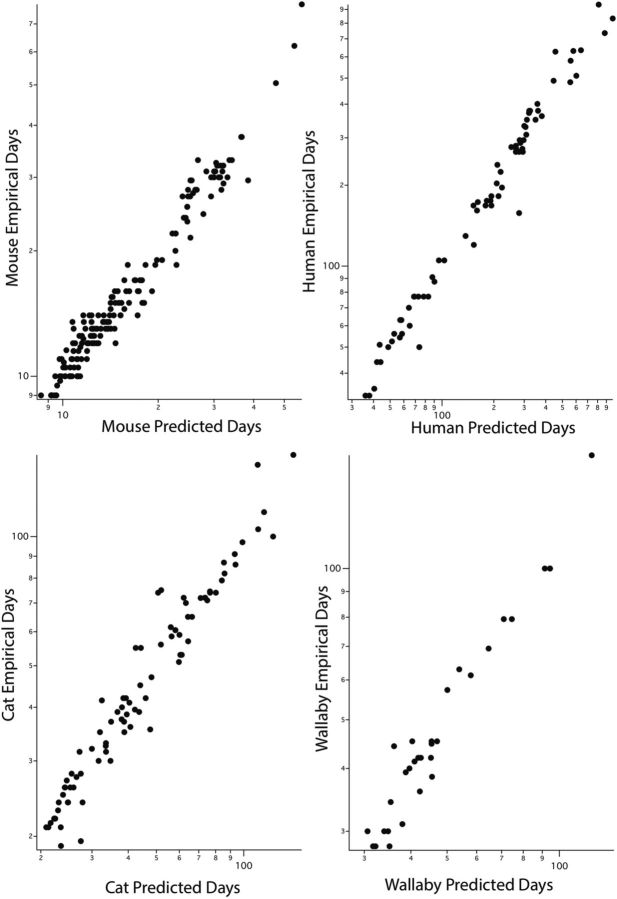
Figure 4.
Fit of empirical data to model values in four representative species. The x-axis is the predicted date of occurrence of all the events for which there were also empirical data points; the y-axis is the empirical value of the measured event in that species. As described in several technical aspects in the texts, the fit of predicted to actual days is very high.

