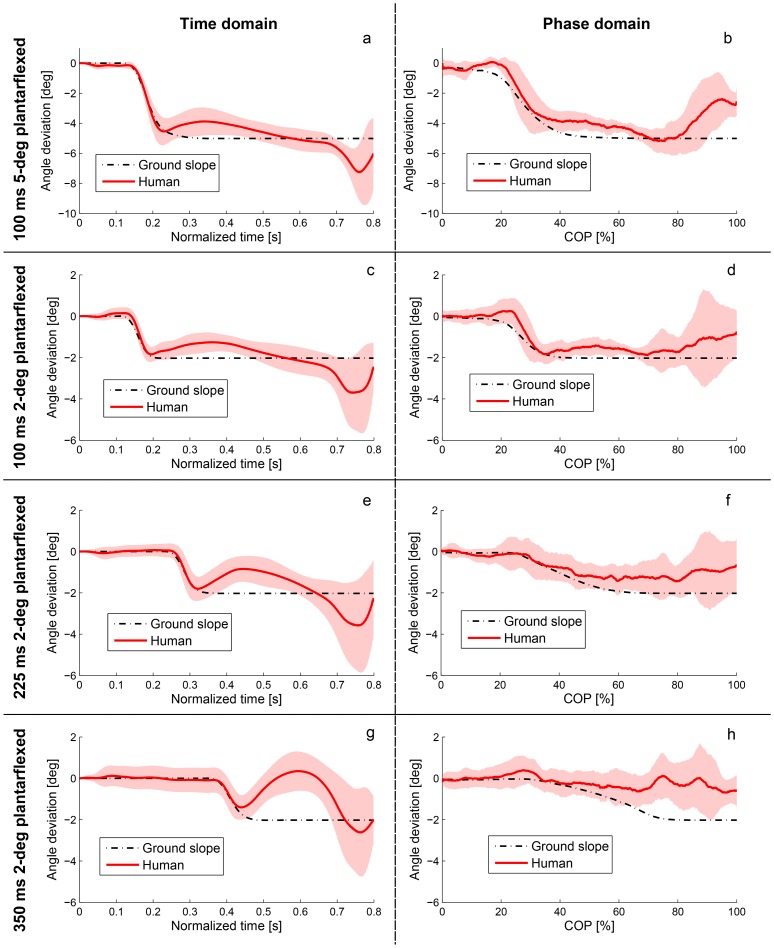
Figure 6. Human responses to plantarflexive (negative) perturbations at 100 ms, 225 ms, and 350 ms after heel strike.
Human deviations from the nominal trajectory after 5-degree perturbations at 100 ms (a, b) and 2-degree perturbations at 100 ms (c, d), 225 ms (e, f), and 350 ms (g, h) in both time domain (left) and phase domain (right). Human responses are shown by mean value and error bars (±1 standard deviation shown in the shaded region), and the perturbation window is shown by the ground slope trajectory in dash-dotted black. The perturbed ankle trajectories appear to converge in the phase domain just below the nominal trajectory as predicted in H4 (note that humans do not normally plantarflex their ankle pattern by the slope angle during downhill walking [39]–[41], so we should not expect the ankle deviation to converge to the perturbation slope angle, see Methods). The perturbation does not appear to start exactly at 225 ms in (e) or 350 ms in (g) because the slope trajectory is plotted over normalized time (which is scaled between 0 and 0.8 s). The perturbation window appears stretched in the phase domain compared to the time domain for two reasons: 1) the COP naturally moves faster during the time window of these perturbations, which therefore occupy a larger portion of the phaseline, and 2) the COP location at perturbation times varies due to normal variation in walking speed, so averaging the perturbation trajectory over COP samples results in a widened window. In other words, perturbations start at different points in phase between trials, which are averaged into one longer window.

