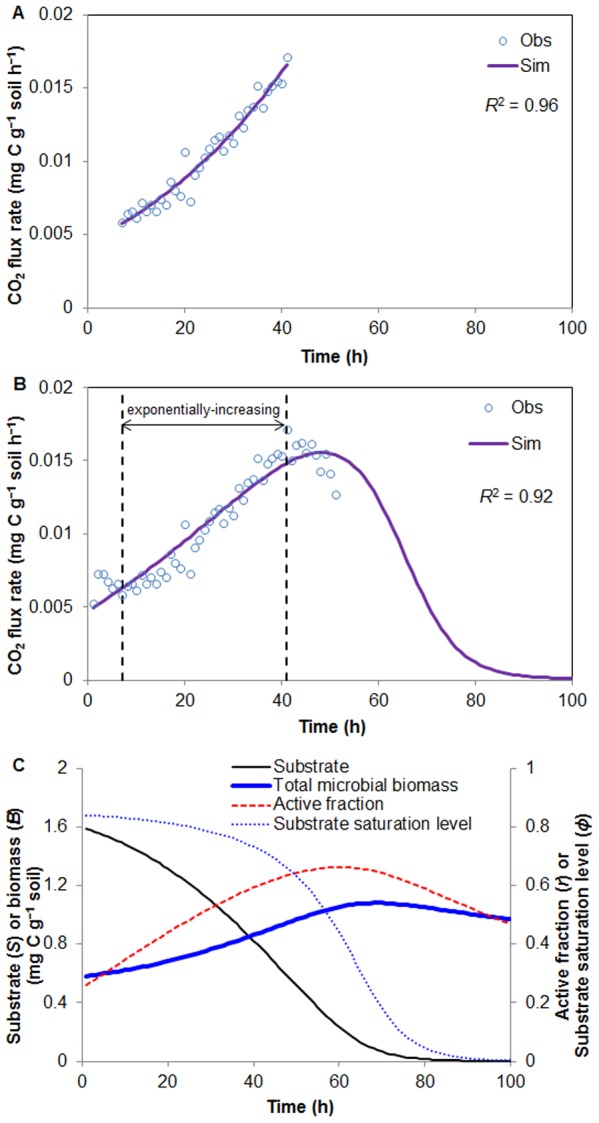
Figure 3. MEND model simulations against the respiration rates due to added 14C-labeled glucose in Colores et al. [13].

(a) Fitting of the respiration rates in the exponentially-increasing phase using Equation 14, ‘Obs’ and ‘Sim’ denote observed and simulated data, respectively. (b) Fitting of the respiration rates in both exponentially-increasing and non-exponentially-increasing phases using Equation 12. (c) Simulated substrate (S), total live microbial biomass (B), active fraction (r) and substrate saturation level ( ) based on Equation 12.
