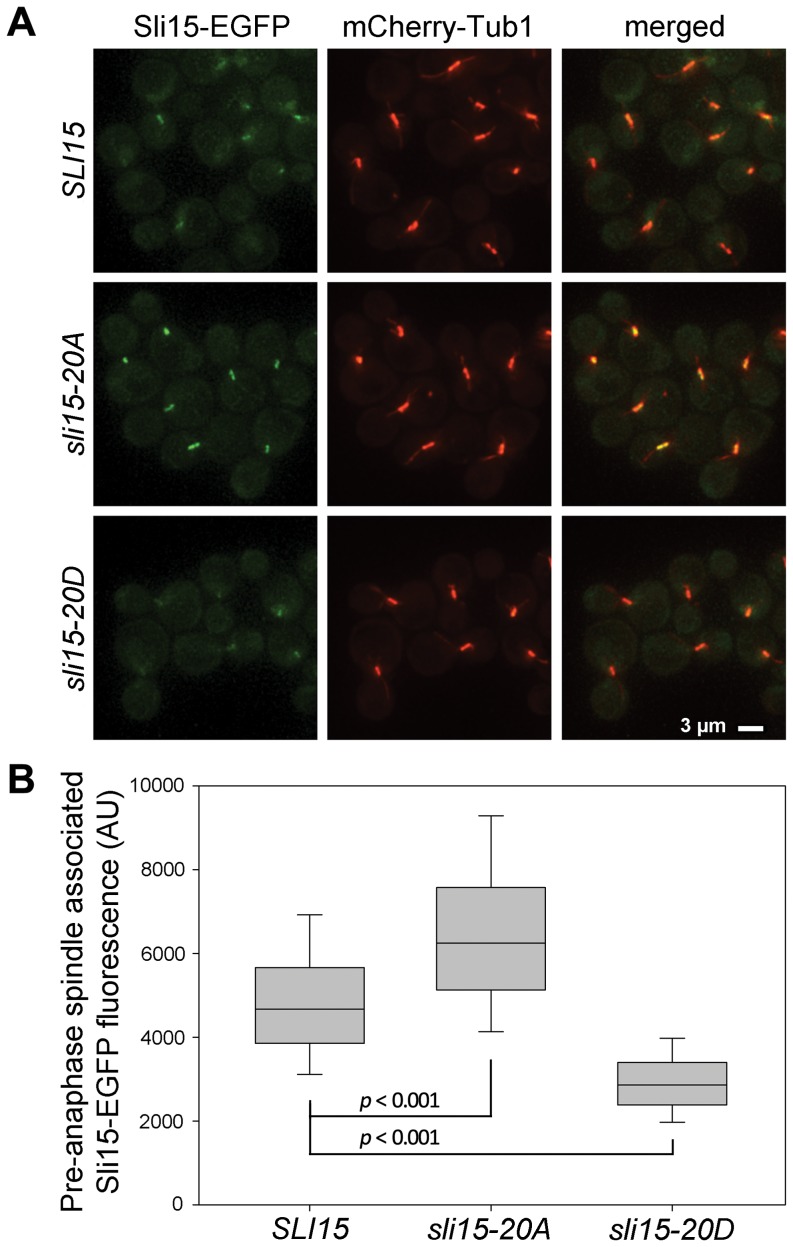
Figure 6. Localization of Sli15, Sli15-20A and Sli15-20D in metaphase-arrested cells.
VMY357 (SLI15-EGFP), SJC591 (sli15-20A) and VMY375 (sli15-20D) cells containing mCherry-TUB1 and pMET3-CDC20 were arrested in G1 with α-factor at 26°C and then released to a metaphase block in rich medium for 2.5 h. (A) Representative images of live cells arrested in metaphase. (B) Quantification of spindle associated Sli15-EGFP fluorescence in cells from multiple fields imaged 2.5–3.5 h following α-factor release. The top and bottom of the boxes indicate the 75th and 25th percentiles and the whiskers indicate the 10th and 90th percentiles. Significance levels were determined using the Mann-Whitney U test of the null hypothesis that the medians were identical. SLI15 vs. sli15-20A: Mann-Whitney U = 36165, nSLI15 = 378, nsli15-20A = 387, p<0.001, two tailed. sli15-20D vs. SLI15: Mann-Whitney U = 15992, nsli15-20D = 381, nSLI15 = 378, p<0.001, two tailed. Data shown are representative of three separate experiments. AU, arbitrary units of fluorescence.

