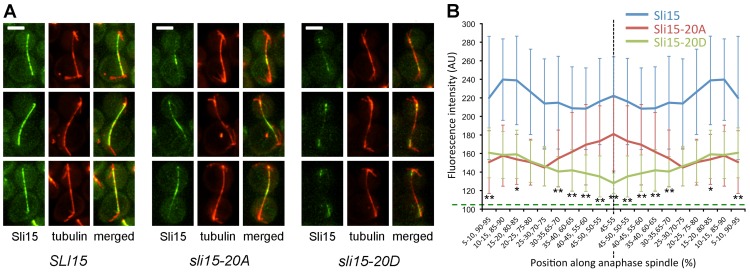
Figure 8. Localization of Sli15, Sli15-20A and Sli15-20D in anaphase cells.
Metaphase-arrested cells of strains VMY357 (SLI15-EGFP), SJC591 (sli15-20A) and VMY375 (sli15-20D) prepared as in Figure 6 and allowed to progress into anaphase. (A) Representative images of anaphase cells from each strain (Sli15, Sli15-EGFP; tubulin, mCherry-Tub1). Bar, 3 µm. (B) Distribution of Sli15-EGFP along anaphase spindles in each strain. Sli15-EGFP fluorescence intensity along 12-16 anaphase spindles (6.0–12.6 µm) in each strain was measured on a normalized length scale of 0-100% and intensities sorted into 20 bins of increasing distance from the center of the spindle as shown, treating spindles as symmetrical. The mean fluorescence intensities in each region are plotted (error bars indicate standard deviation of the sample). Background fluorescence (∼100 arbitrary units; AU) was not subtracted but is indicated by the horizontal dashed line. The statistical significance of differences in the distribution of the Sli15-20A and Sli15-20D values in each bin was evaluated using the Mann-Whitney test (* = p<0.01; ** = p<0.001). The Sli15 wild-type profile was significantly different from the other two profiles at all points.

