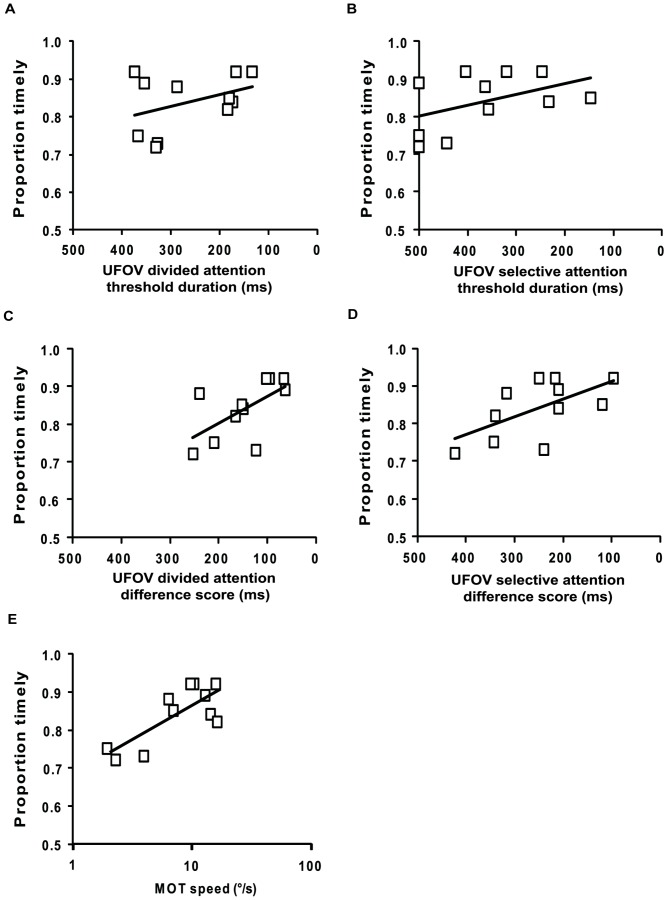
Figure 2. Relationship between proportion of timely reactions and attention measures for CFL participants.
(a) UFOV divided attention threshold duration, (b) UFOV selective attention threshold duration, (c) UFOV divided attention difference score, (d) UFOV selective attention difference score, and (e) the MOT task. Better performance on the pedestrian detection task was associated with better performance on each of the attention tests. UFOV scores are plotted on reversed axes so that better performance is at the right hand side of the x-axis for all figures. Thick black line shows the linear trend.

