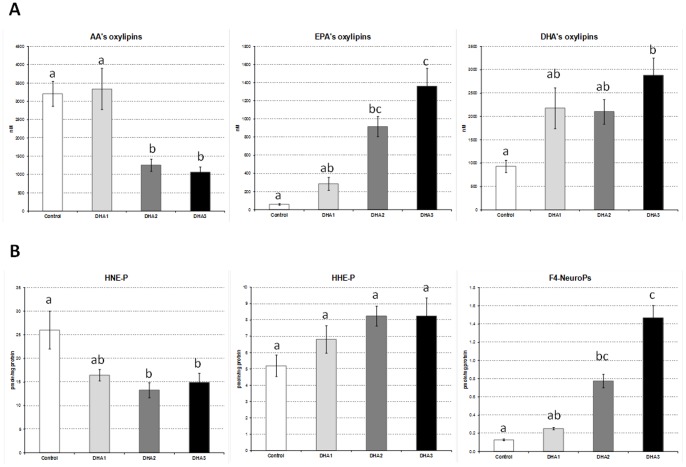
Figure 4. Profiles of PUFAs’s oxygenated metabolites.
(A) Plasma concentrations of oxylipins originating from AA (20∶4 n-6), EPA (20∶5 n-3), and DHA (22∶6 n-3). (B) Liver contents of peroxidation metabolites originating from n-6 PUFAs (4-HNE-P), n-3 PUFAs (4-HHE-P) and DHA (F4-NeuroPs). Data represent means ± SEM (n = 10/group). a,b,c Mean values with unlike letters were significantly different (p<0.05).

