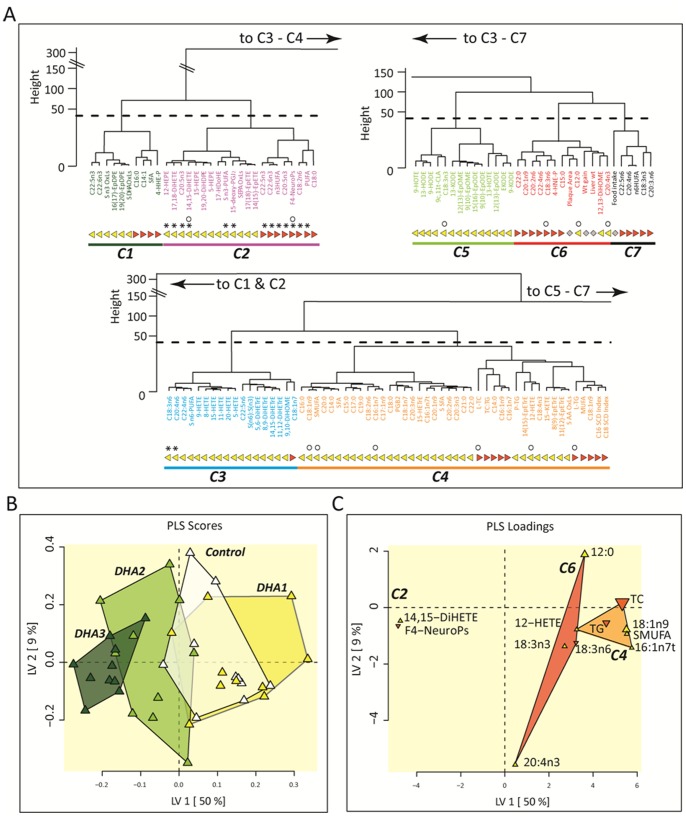
Figure 6. Hierarchical cluster and Partial Least Squares Discrimination Analysis (PLS-DA).
(A) Complete data sets (n = 10/group) were segregated into 7 unique clusters of variables (C1–C7) by hierarchical cluster analysis. Clusters were assigned unique colors and used to highlight variables in PLS-DA. Plasma and liver variables are indicated by yellow triangles and orange inverted triangles, respectively. Dominant variables for feeding group discrimination are identified by asterisks (*). Dominant variables for plaque area discrimination are identified by open circles (○). (B) Animals eating each dietary mixture with complete data sets (n = 10/group) were partially segregated by PLS-DA. Mice from DHA1 group were indistinguishable from Controls (p<0.05), while DHA2 (p<0.0001) and DHA3 (p<1.5E-07) were significantly different in this model. (C) Plasma (yellow triangle) and liver (orange triangle) metabolites belonging to clusters C2, C4, and C6 as identified in (A) were included in this model. Predictive variables are labeled with their point size, indicating relative selection frequency of 20–80% in 10 models constructed using a Pearson’s-correlation variable selection filter which out performed other filters in terms of the minimum root mean squared error of prediction (RMSEP = 3.4±1). Analytes appearing in ≥30% of models were retained for the final predictive model construction.

