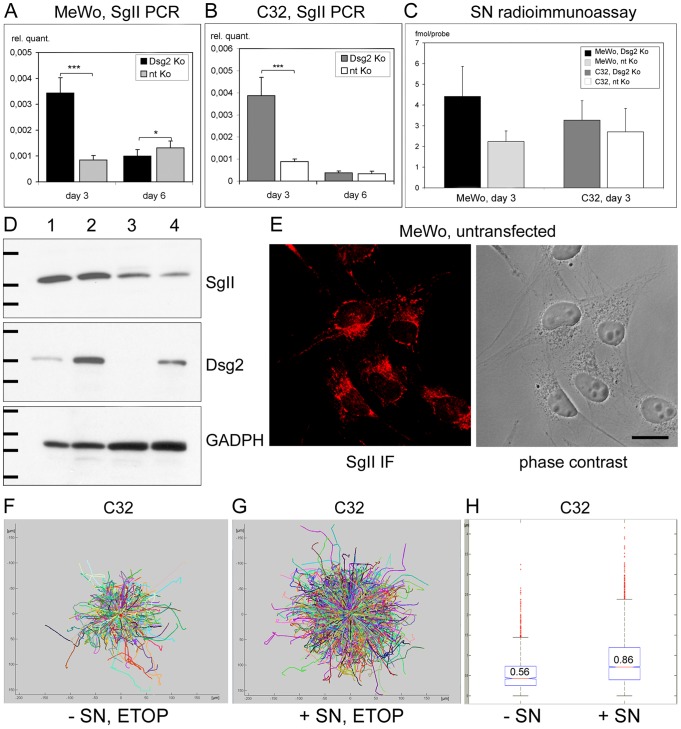
Figure 7. Upregulation of SgII and SN upon Dsg2 depletion and increased melanoma cell migration upon stimulation with SN.
(A, B) Real time PCR showing significantly increased SgII mRNA in subconfluent but not in confluent Dsg2-depleted MeWo and C32. In subconfluent cultures harvested three days after the first siRNA transfection, 4.1-fold more SgII mRNA (MeWo, A) or 4.4-fold more SgII mRNA (C32, B) was detected after Dsg2 knockdown. However, in confluent cultures harvested after six days amounts of SgII mRNA were equal in the C32 samples (B) and slightly decreased in Dsg2-depleted MeWo (1.3-fold, A). (C) RIA demonstrating marked upregulation of SN in cellular extracts of Dsg2-depleted MeWo (4.42 vs. 2.24 fmol/probe, p = 0.0704) and slight SN increase in Dsg2-depleted C32. Bars: SD; * p≤0.05, *** p≤0.001. (D) Immunoblots of total cell lysates from subconfluent Dsg2-depleted MeWo (lane 1), nt siRNA-treated MeWo (lane 2), Dsg2-depleted C32 (lane 3) and nt siRNA-treated C32 (lane 4), harvested three days after the first siRNA transfection. SgII (detected with rabbit antiserum GTX116446) was upregulated 1.6-fold in Dsg2-depleted MeWo as compared to MeWo controls and 1.5-fold in Dsg2-deleted C32 as compared to C32 controls when the intensity of the bands was normalized against the GADPH blot serving as loading control. Dsg2 was depleted 3.1-fold (MeWo) or 26.3-fold (C32) after knockdown. Molecular weight markers (from top to bottom): SgII immunoblot: 97.2, 66.4 and 55.6 kDa; Dsg2 immunoblot: 212, 158 and 116 kDa; GADPH immunoblot: 55.6, 42.7, 34.6 and 27 kDa. (E) Confocal laser scanning micrographs of untreated MeWo cells stained with SgII antibodies (GTX116446). IF – immunofluorescence. Bar: 20 µm. (F-H) Enhanced melanoma cell migration after stimulation with SN. Migration of unstimulated (“- SN”) or SN-stimulated (“+ SN”) C32 on fibronectin was documented by live cell microscopy for 3.5 h. (D, E) Equalize track origins plots reveal larger migration distances after SN stimulation. (F) Bar diagram presenting average mean displacement, 25th and 75th percentiles (box) and individual measurements (red dots).

