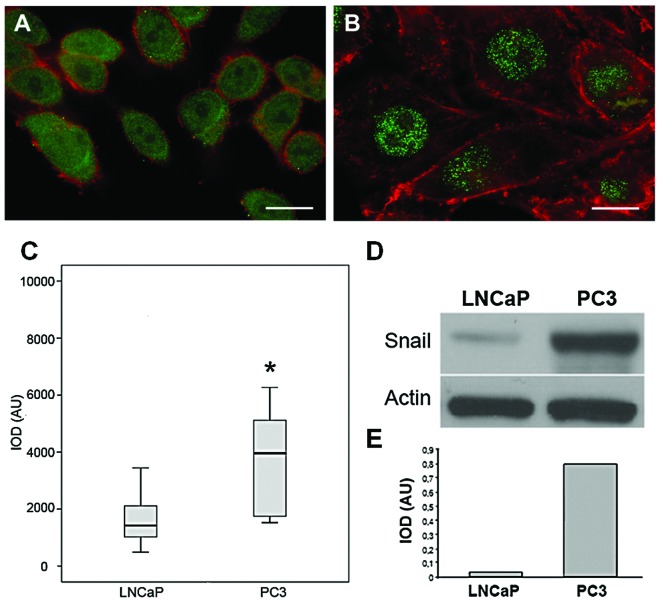
Figure 5.
SNAIL expression and localization in LNCaP and PC3 cell lines. Flat-Z microphotographs in (A) LNCaP and (B) PC3 cell lines. SNAIL (green) and actin cytoskeleton (red). (C) Semi-quantification of SNAIL immunofluorescence in LNCaP and PC3 cell lines. (D) Western blot analysis of SNAIL in LNCaP and PC3 cell lines. (E) Densitometric analysis. IOD, integrated optical density. AU, arbitrary units. *P<0.01. Scale bar, 50 μm.

