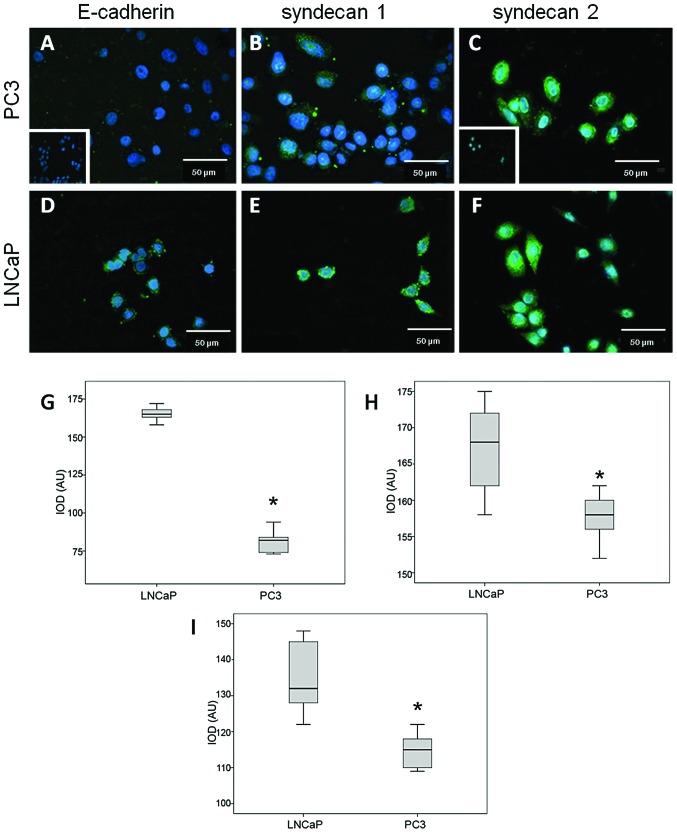
Figure 6.
Syndecans 1 and 2 and E-cadherin ectodomain localization in LNCaP and PC3 cell lines. (A) E-cadherin ectodomain, (B) syndecan 1 and (C) syndecan 2 in PC3 cell line. (D) E-cadherin ectodomain, (E) syndecan 1 and (F) syndecan 2 in LNCaP cell line. Inserts, negative controls. DAPI for nuclear staining. Magnification, ×400. (G, H and I) Semi-quantification of syndecan 1, syndecan 2 and E-cadherin, immunofluorescence in LNCaP and PC3 cell lines, respectively. IOD, integrated optical density. AU, arbitrary units. *P<0.01.

