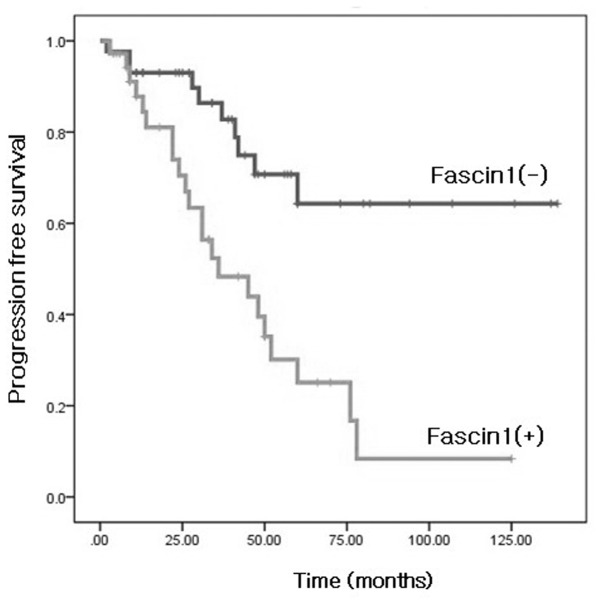
Figure 2.
Kaplan-Meier survival analysis of progression-free survival in all patients according to fascin1 expression. Significant differences among the subgroups with positive (dimed line) and negative (bold line) fascin1 expression indicate poor outcomes in patients with fascin1 expression group. Fascin1 expression group was significantly correlated with shorter progression-free survival (P<0.001). The log-rank test yielded significant P-values.

