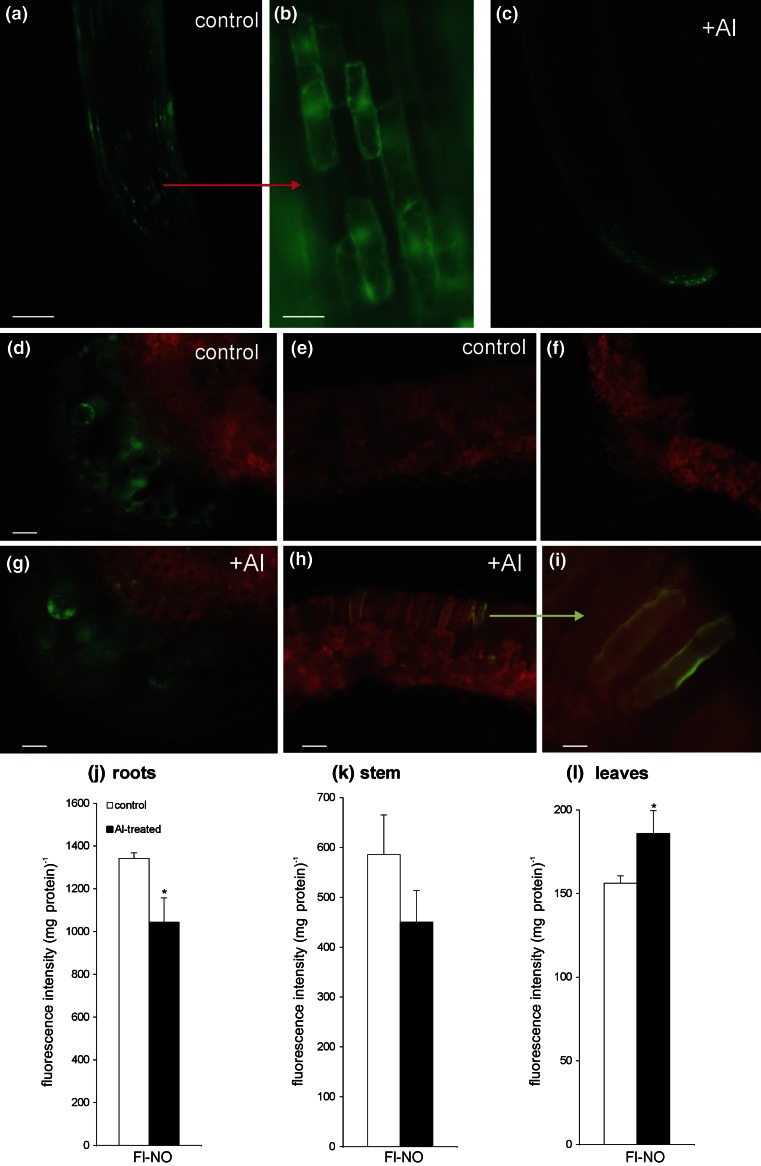
Fig. 3.
Bio-imaging of NO with a Cu-FL fluorescent probe in potato roots (a–c) and leaves (d, e, g–i) at 48 h after root exposure to 250 μM AlCl3. Images show general phenomena representative of three individual experiments; control of background where the fluorescent probe was omitted (f). Bars indicate 200 μm (d–f), 100 μm (a, c, g, h) and 20 μm (b, i). Measurement of FL-NO fluorescence in extracts of potato roots (j), stems (k) and leaves (l) exposed to aluminum. NO production was assayed spectrofluorimetrically using a selective NO sensor (Cu-FL). FL-NO fluorescence intensity represents mean values for the average of data ± SD of three independent experiments

