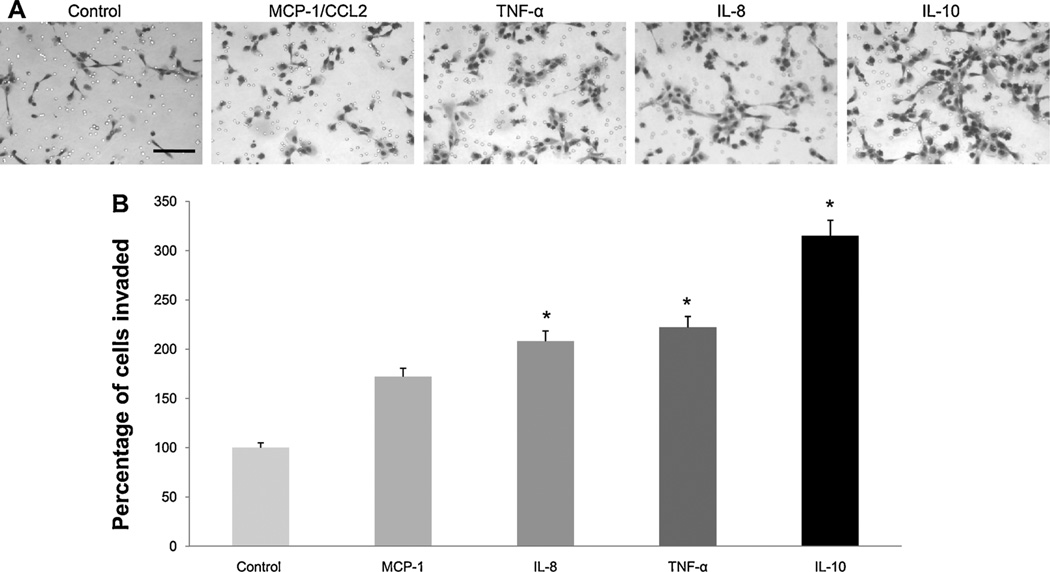
Fig. 6.
Cytokines stimulate invasion of SUM 149 IBC cells. (A) Images are representative of SUM 149 cells that invaded through the rBM-coated filters in response to either control culture media, MCP-1/CCL2, TNF-α, IL-8 or IL 10. Results are representative of three independent experiments; scale bar=150 µm. (B) Quantification of cells that invaded was performed by counting the average number of nuclei in 5 fields of view per filter (using ImageJ) and is expressed as percentage of cells invaded as compared to control. Results are representative of three independent experiments and are expressed as mean ± SD; * represents p≤ 0.05 as determined by Student’s t-test.

