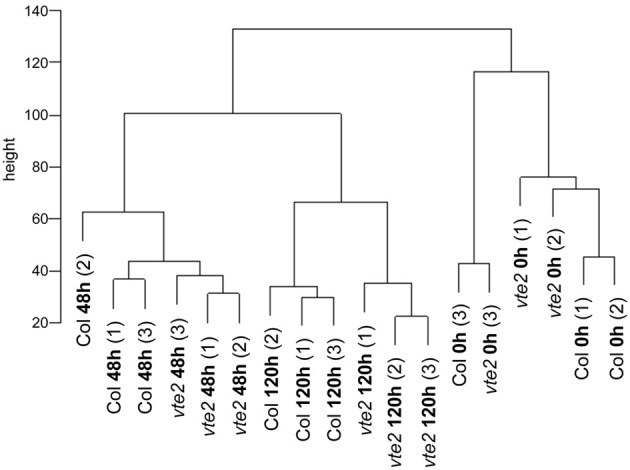
Figure 1.

A cluster dendrogram of a correlation matrix for all-against-all chip comparisons. The scale on the vertical bar “height” indicates Manhattan distance. The numbers (1) to (3) indicate three independent biological replications for treatments and genotypes. The samples cluster by different genotypes (Col and vte2) after LT treatment (48 and 120 h).
