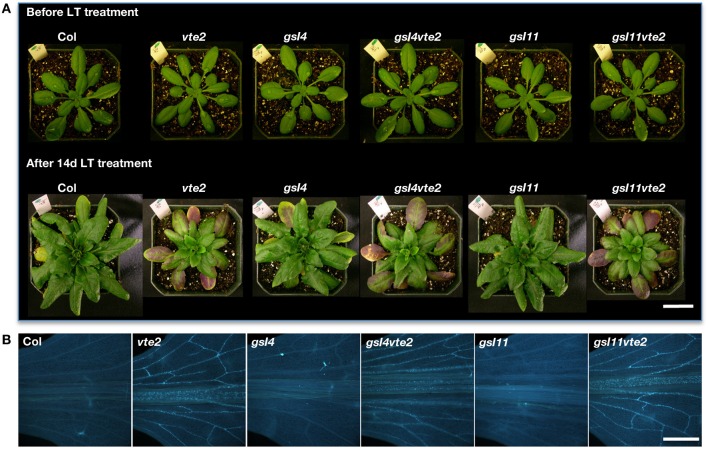
Figure 4.
Whole plant and vascular callose phenotypes of Col, vte2, gsl4, gsl4 vte2, gsl11, and gsl11 vte2. All genotypes were grown under permissive conditions for 4 weeks and then transferred to LT conditions for the specified periods previously shown to maximize each phenotype (Maeda et al., 2006). (A) Whole plant phenotype of the indicated genotypes before (top) and after (bottom) 28 days of LT treatment. Bar = 2 cm. (B) Aniline-blue positive fluorescence in the lower portions of leaves after 3 days of LT treatment. Samples for callose staining were fixed in the middle of the light cycle. Representative images are shown (n = 3). Bar = 1 mm.

