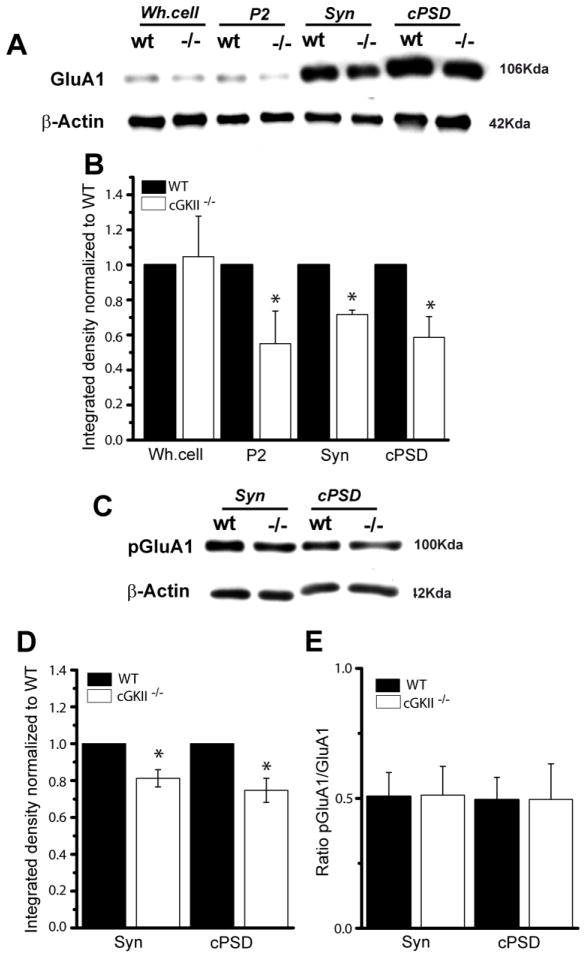
Figure 2. Reduced GluA1 in the synaptic fraction of cGKII KO (cGKII−/−) mice.
Subcellular fractions of the cerebellum from 14 day old WT and cGKII−/− mice were analyzed in immunoblots. P2: crude membranes; syn: synaptoneurosome; PSD: postsynaptic density. (B) Quantification of GluA1 immunoreactivity normalized to β-actin and finally, to WT values (*p < 0.05, n = 3). (C) Cerebellar fractions probed in immunoblots with a rabbit PO-S845-GluA1 antiserum. (D) Quantification of GluA1 phosphorylation in the synaptoneurosomal and crude PSD fractions. (E). Ratio between the phosphorylated and total GluA1 in the synaptic fractions. Data are represented as the mean ± SEM and analyzed using unpaired, two-sample t test (n=3; *p<0.05).

