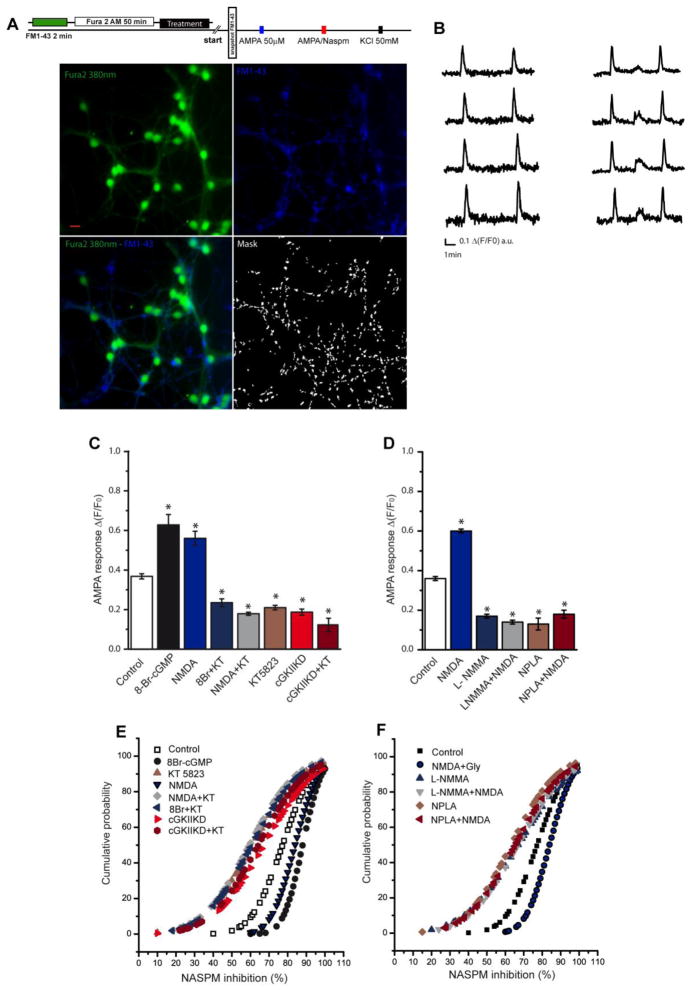
Figure 7. The [Ca2+] in individual cerebellar granule cells.
(A) Scheme of the experiment and representative pictures showing Fura 2-AM, FM1-43 fluorescence and the binary mask obtained from the FM1-43 image (scale bar: 10μm). (B) Representative AMPA elicited calcium responses and their inhibition by NASPM: AMPA (50 μM) + cyclothiazide (10 μM: 1st stimulus), AMPA (50 μM) + cyclothiazide (10 μM) in the presence of NASPM (10 μM: 2nd stimulus), and KCl (50 mM) used as a control of depolarization (3rd stimulus). (C) Δ(F/F0) of the AMPA response for each condition expressed as the mean ± SEM (control, 1,363 ROIs analyzed from 9 experiments; 8Br-cGMP, 823 ROIs from 6 experiments; NMDA, 341 ROIs from 5 experiments; KT5823, 817 ROIs from 9 experiments; 8Br+KT, 315 ROIs from 6 experiments; NMDA+KT, 454 ROIs from 5 experiments; cGKII KD, 1,138 ROIs from 4 experiments; cGKII KD+KT, 882 ROIs from 4 experiments). (D) Δ(F/F0) of the AMPA response for each condition expressed as the mean ± SEM (control, 220 ROIs analyzed from 2 experiments; NMDA, 140 ROIs from 2 experiments; L-NMMA, 130 ROIs from 2 experiments; NMDA+L-NMMA, 145 ROIs from 2 experiments; NPLA, 200 ROIs from 2 experiments; NPLA+ NMDA, 108 ROIs from 2 experiments). (E) Cumulative probability plots of the percentage of inhibition produced by NASPM of the AMPA-induced calcium responses in the different experimental conditions (p<0.05, Kolmogorov–Smirnov tests). (F) Cumulative probability plots of the percentage of inhibition produced by NASPM of the AMPA-induced calcium responses in the different experimental conditions (p<0.05, Kolmogorov–Smirnov tests). Data from C and D are represented as the mean ± SEM and the statistical significance was analyzed using an unpaired, two-sample t test and one way ANOVA followed by Bonferroni’s test (*p<0.05).

